Share this blog:

USA Week Ahead:
-
Monday - None scheduled, President's Day holiday
-
Wednesday 2pm - Minutes for Jan Fed FOMC
-
Thursday 8:30am - Fed governors speak throughout day
Disclaimer: Nothing here is trading advice or solicitation. This is for educational purposes only.
Authors have holdings in BTC, ETH, and Lyra and may change their holdings anytime.
![]()
Macro Recap:
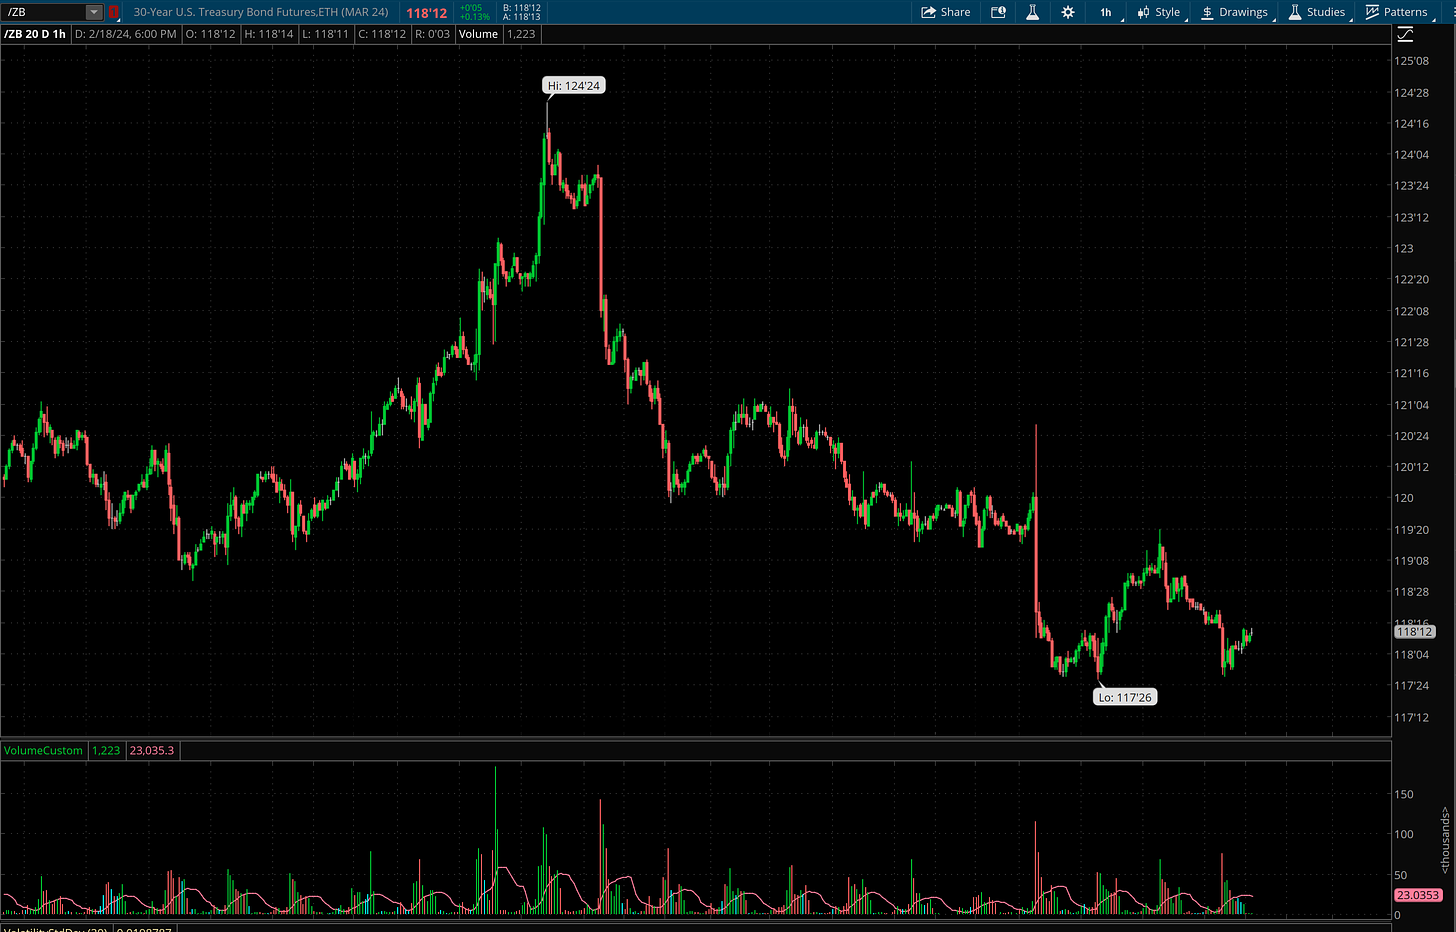
Last week we saw major surprises in terms of the CPI and PPI numbers. Both coming in above expectations and sending rates higher.
Chart: (Bond Futures ThinkorSwim)
The stock market recovered nicely but VIX reacted strongly by quickly moving higher on the back of the CPI number. VVIX as well was caught off-guard as the people scrambled to buy VIX future options, sending VVIX higher.
Chart: (VIX)
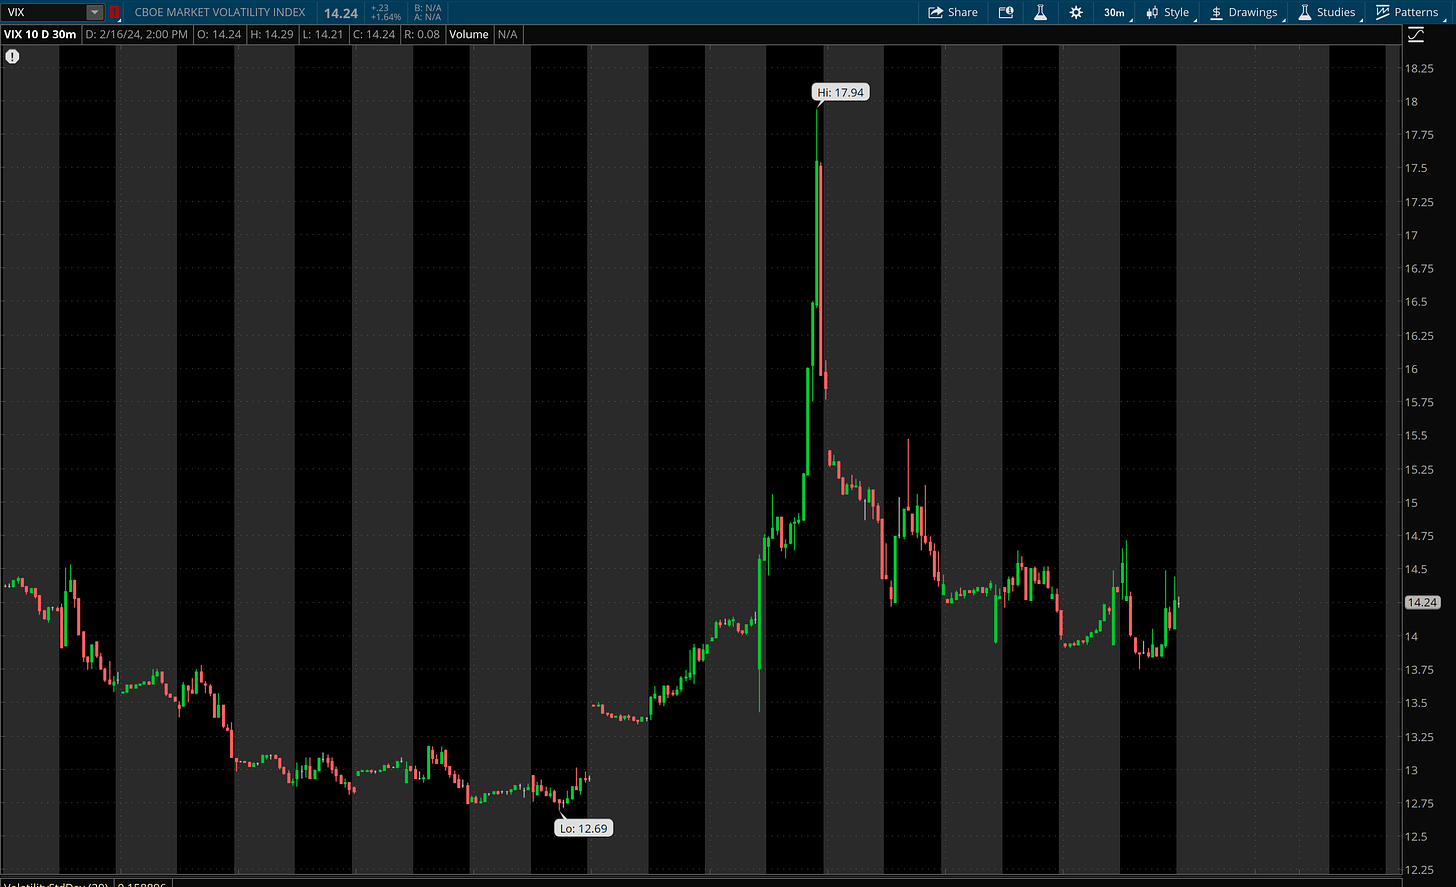
Chart: (VVIX)
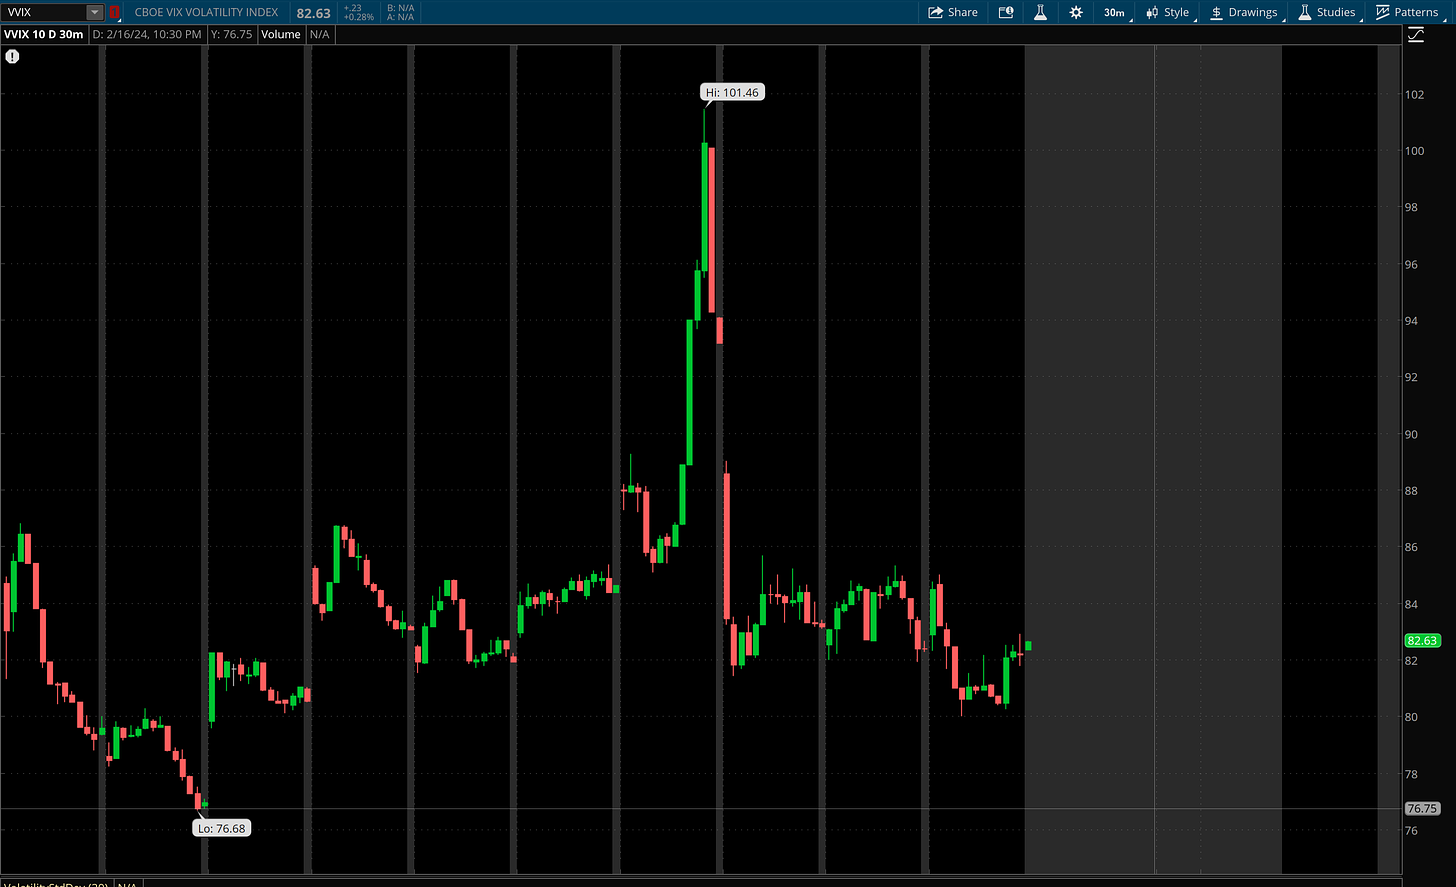
To me, this confirms that the numbers last week truly caught the market by surprise.
This might make Wednesday’s Fed minutes release more sensitive than usual as we get an additional glimpse into the Fed’s current thinking.
However, the Fed has already been very transparent that they expect inflation to gyrate and potentially give negative surprises like last week.
These macro numbers weren’t enough to create headwinds for ETH and BTC as both are moving to their own tunes as Spot ETF flows continue to dominant and a dormant ETH finally begins to wake-up.

BTC: $52,185 (+8.4% / 7-day)
ETH :$2,869 (+15.2% / 7-day)
SOL :$112.22 (+12.3% / 7-day)
Chart: (Amberdata BlockChain Division Data - BTC ETF Flows)
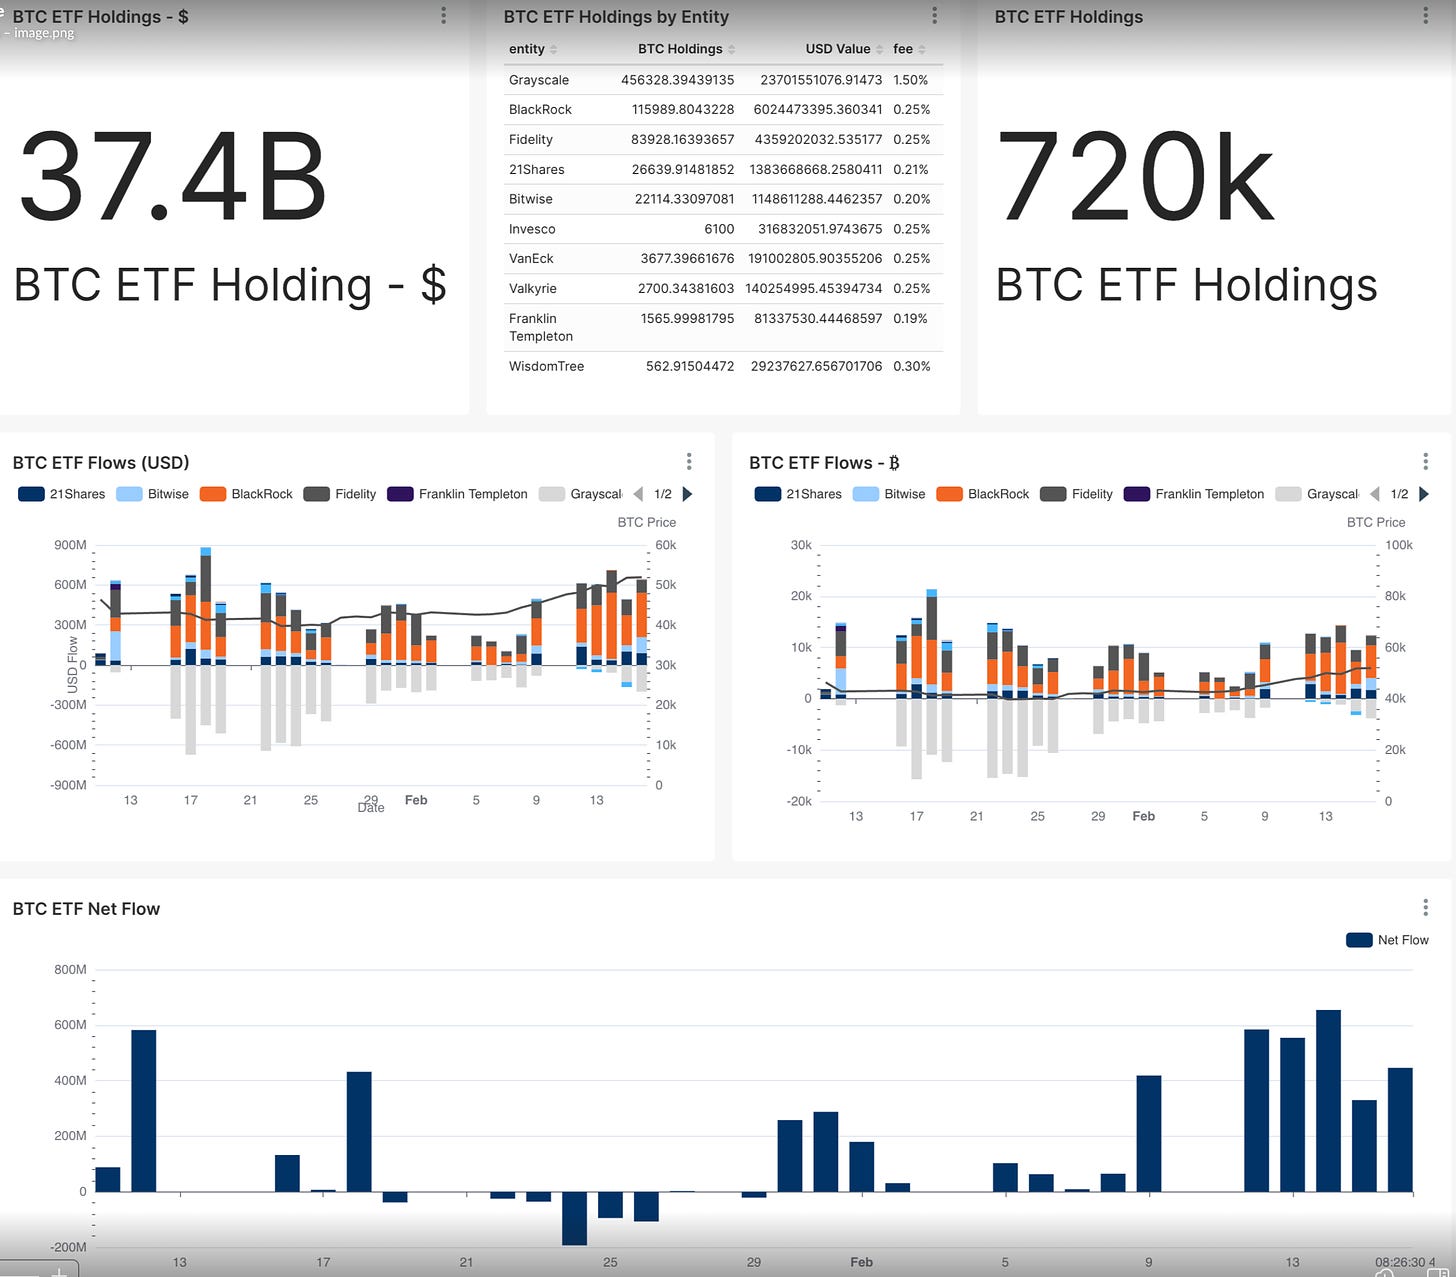
The BTC bull market scenario played out strongly last week, rallying past the 2ø move we outlined in last week’s newsletter.
We continue to see beautiful inflows into the Spot ETFs across the board (except for GBTC, which is nearing neutral flows).
So what now?
My strongest thesis going forward revolves around ETH. I guess that a lot of market participants missed a chunk of the BTC move and now want to buy something that hasn’t “moved” yet.
Chart: (ETH/BTC Ratio Finviz.com)
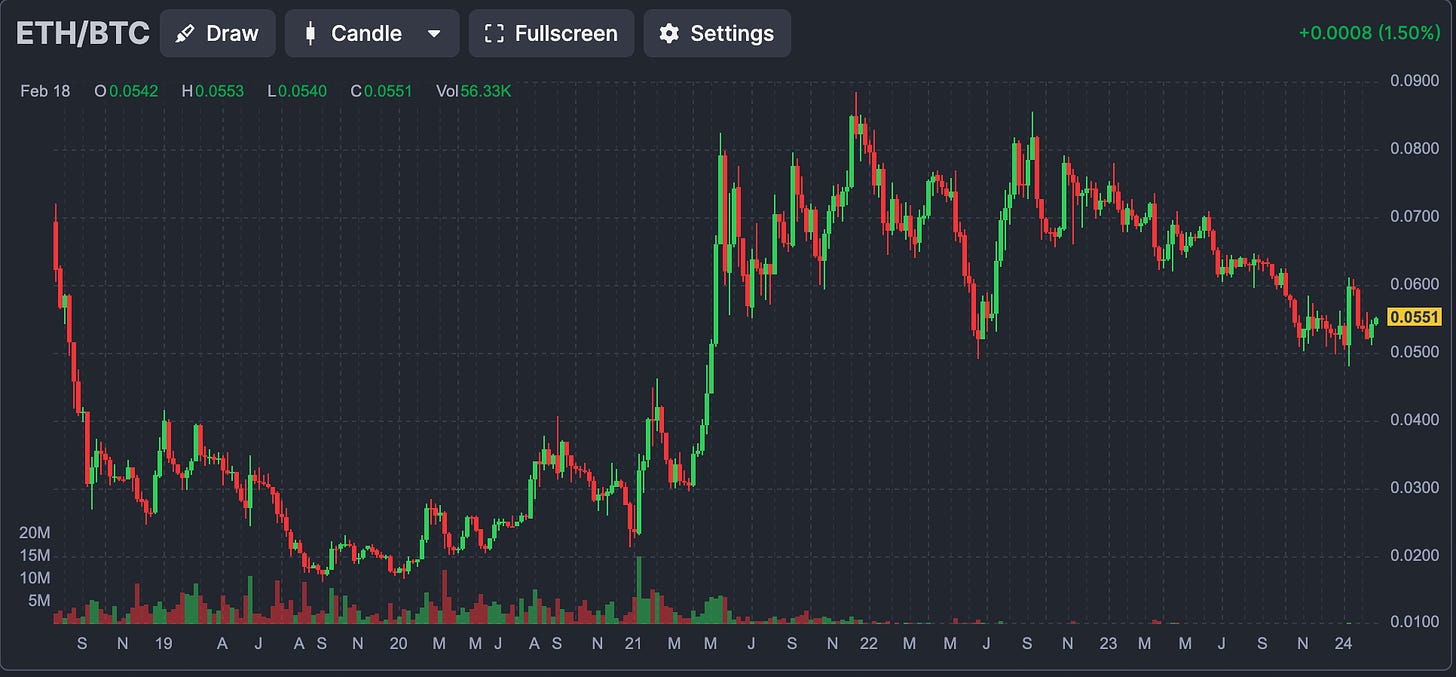
We can see in the chart above that ETH has had a bit of a relative strength bid recently, the recent ETH/BTC ratio high of 0.06 is the next likely target. This implies an ETH price of $3,120.
Combine this ratio target with the ETH spot ETF news catalyst (May 23rd deadline) and things look interesting.
Chart: (Amberdata BlockChain Division - ETH Supply Stats)
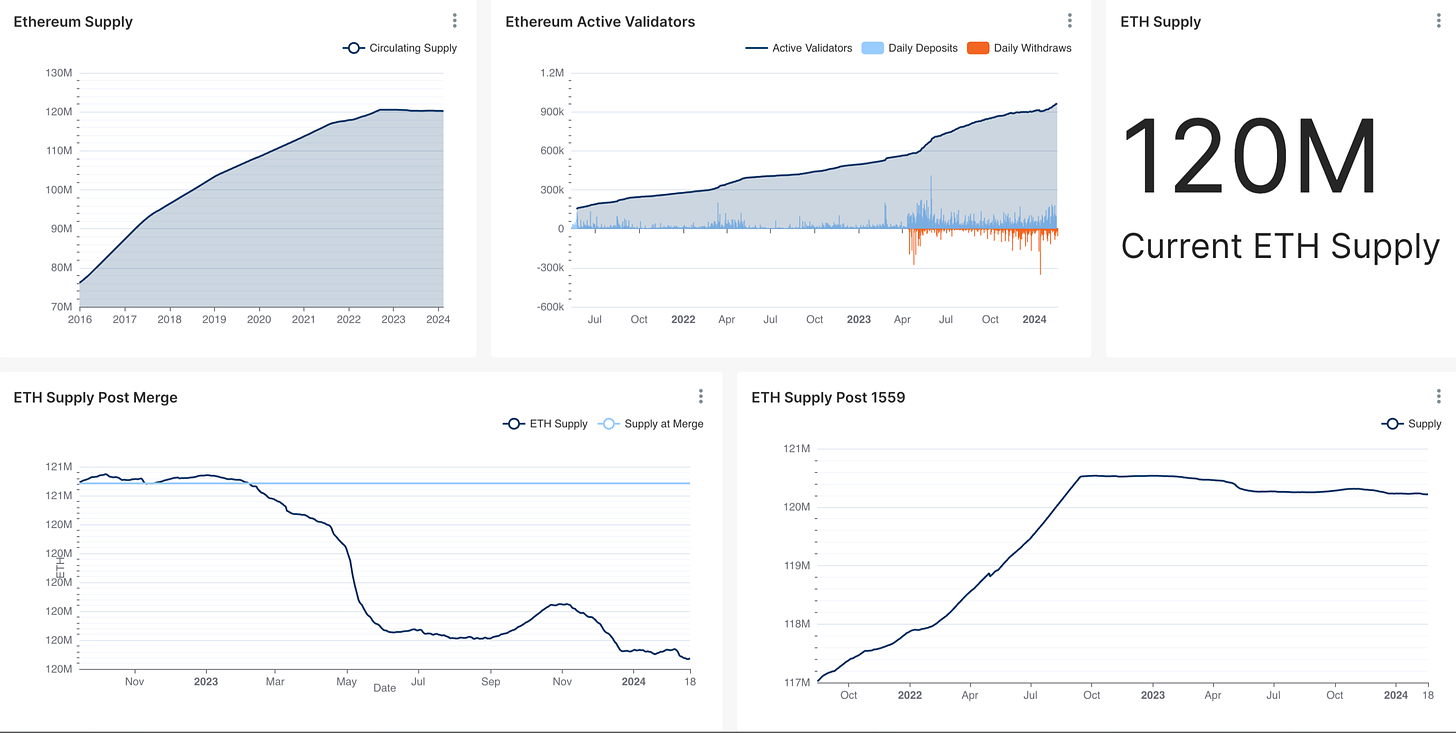
Everyone is talking about the Bitcoin halving in April, but that’s nothing compared to the active “REDUCTION” in ETH supply already occurring since Sept. 2022.
Combine this ETH “Supply BURN” with dormant STAKED ETH and mix in a SPOT ETF actively putting ETH into cold storage… all of a sudden the supply story for ETH is as bullish as fundamentals can get!
Chart: (ETH Term Structure with Forward Vol)
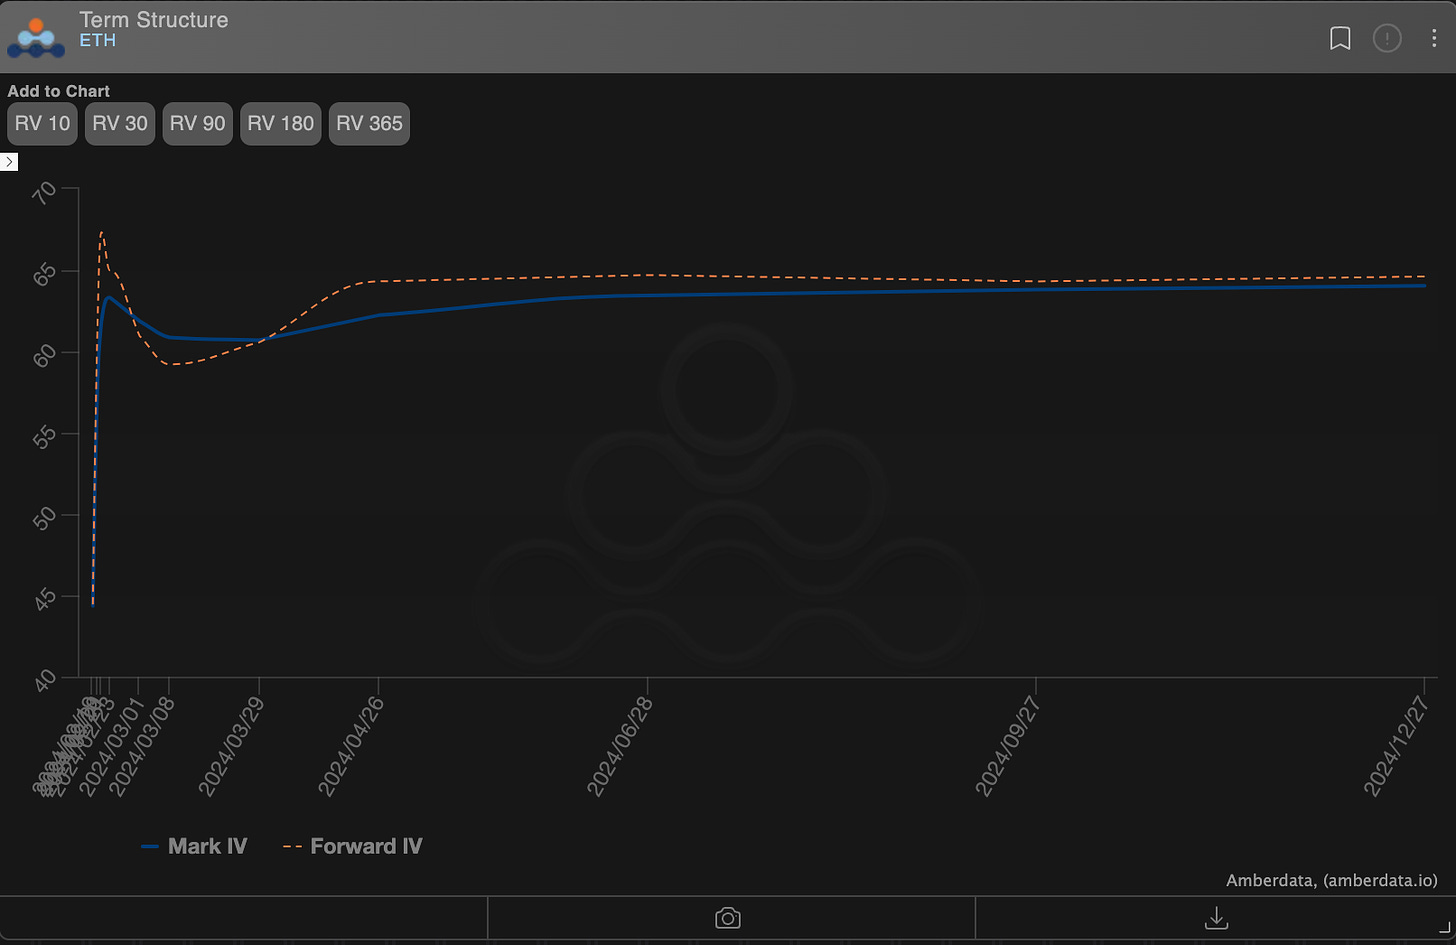
We can see a slight kink higher for the April volatility in ETH maybe in anticipation of Spot ETF “rumor” buying, but this isn’t anything crazy expensive.
Chart: (ETH ∆25 RR-Skew/ATM)
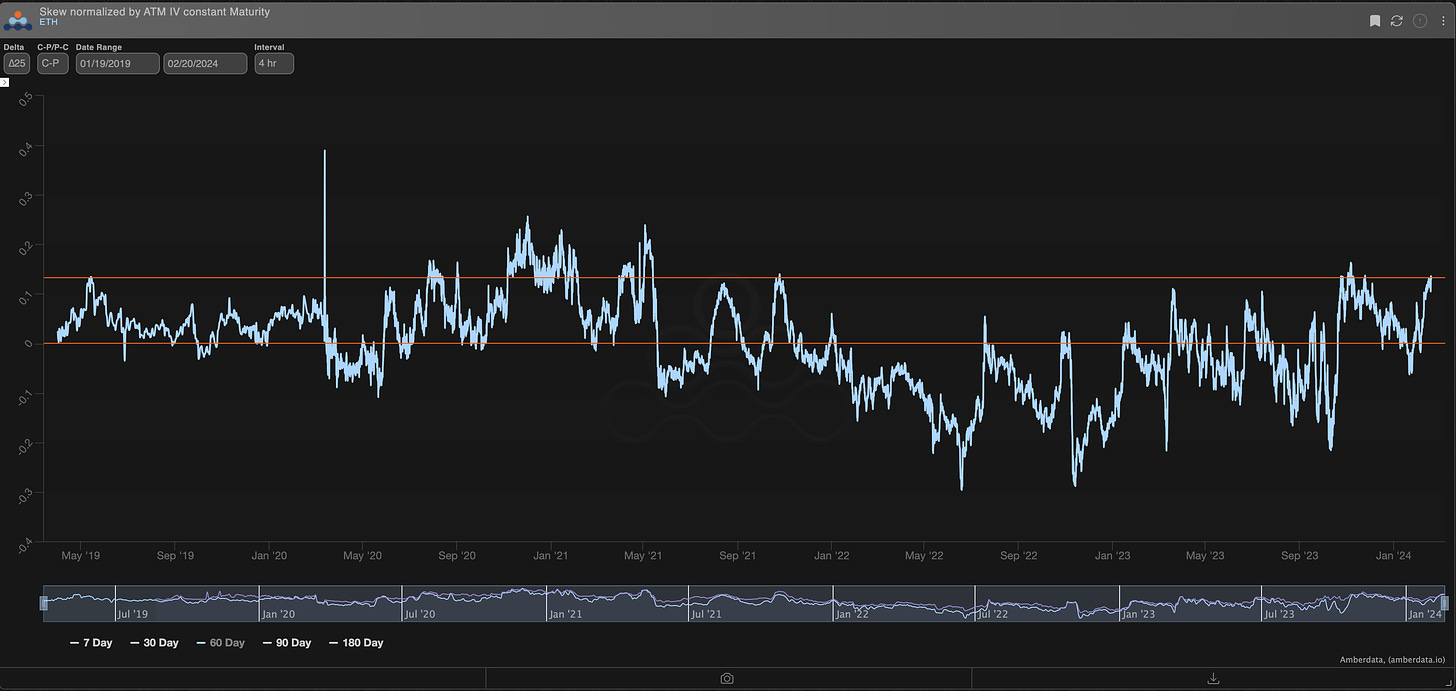
In terms of ∆25 RR-Skew, the April (60-day) expiration has a historically expensive ∆25 Call (This chart has nearly 5-yrs of data). This makes call spreads interesting.
Owning something like (+1)3000-C/(-1)3800-C for about $200, seems appealing.
Chart: (ETH Realized Volatility Cone 5yrs)
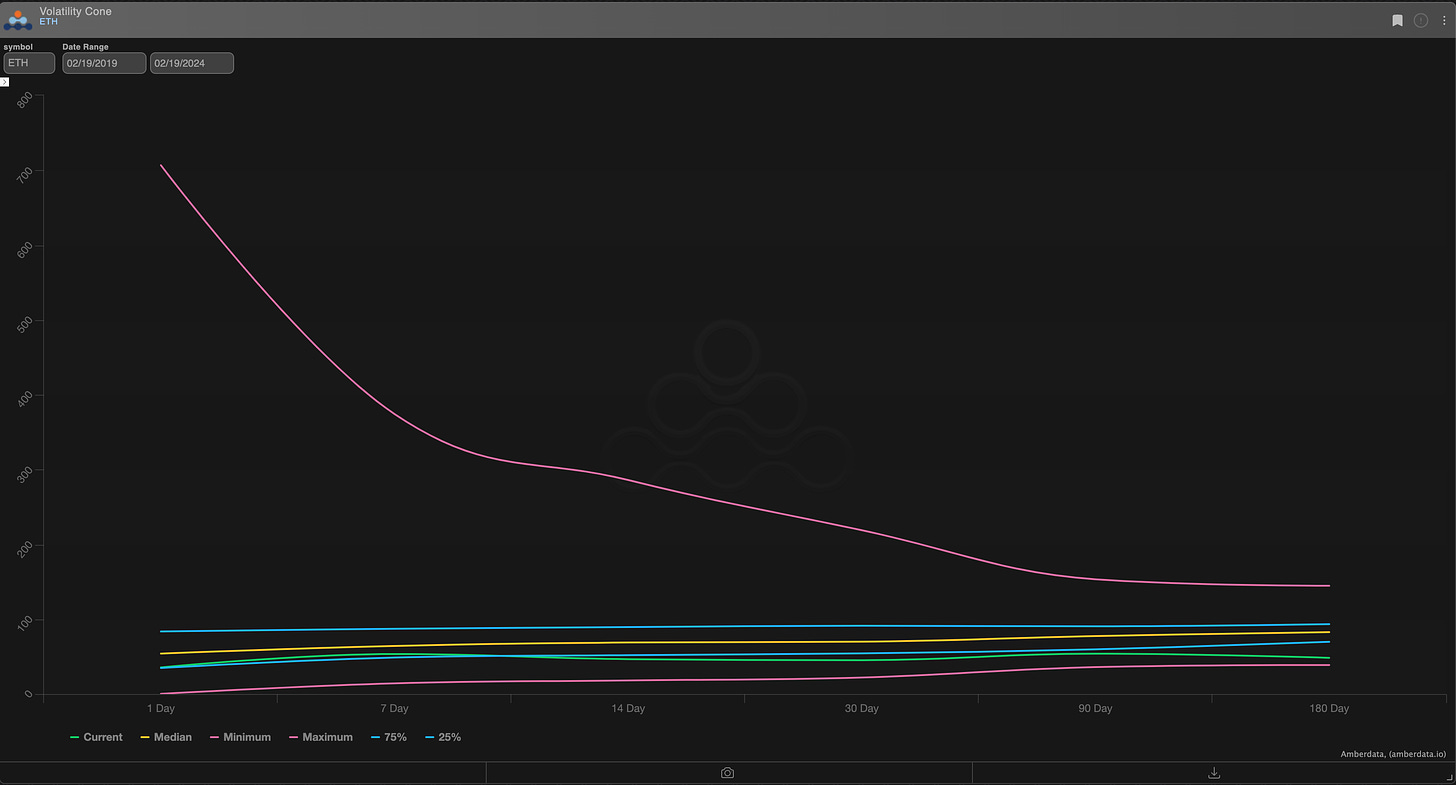
In terms of realized volatility, we can see that we’re still at the historically low <25% percentile for realized volatility. Therefor a Call spread enjoys both historically low RV and a historically steep short ∆25 call-wing.
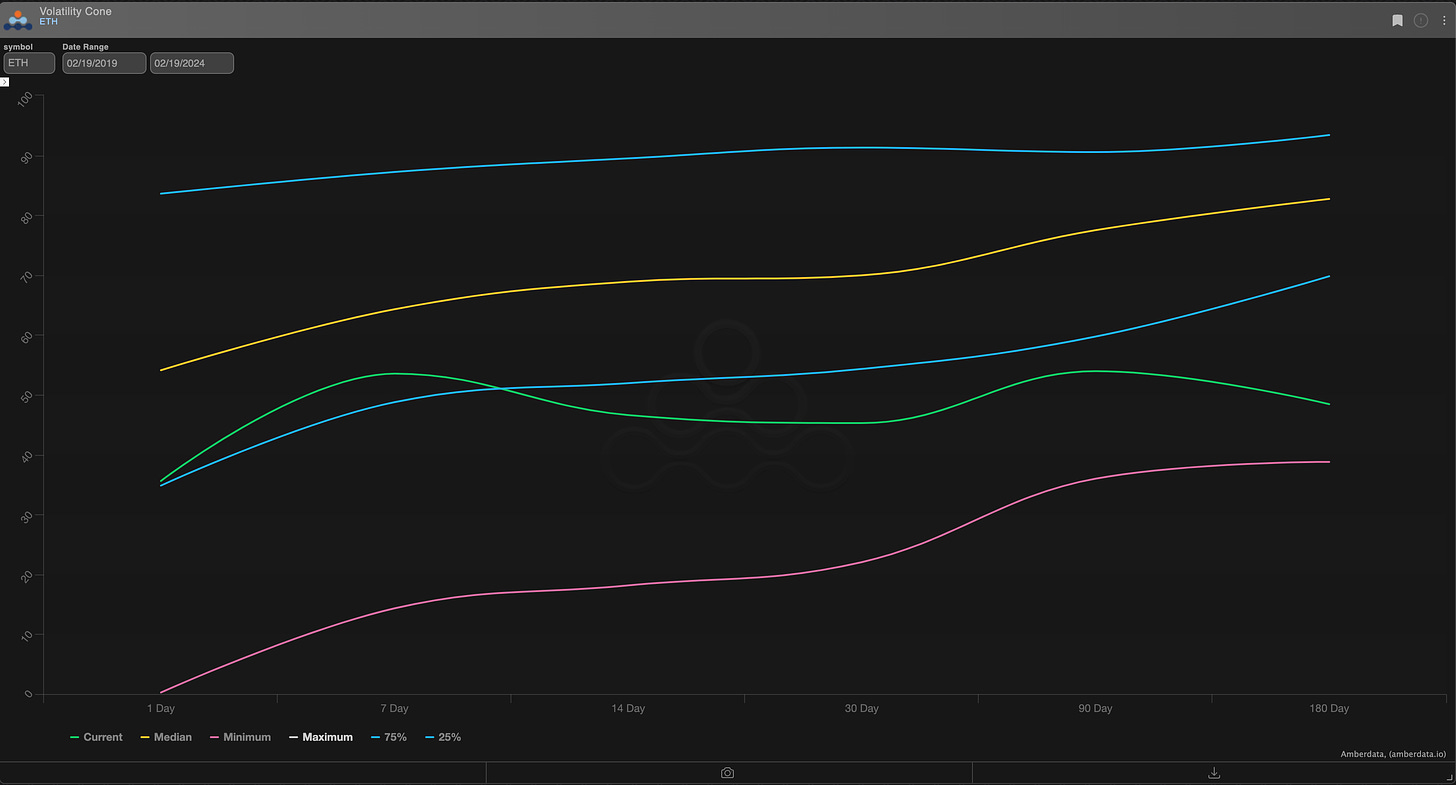
Here’s a better look at the volatility cone by excluding the “MAX” RV component. Notice the Green “current RV” line.
TL:DR
ETH is the next play here!
- Low ETH/BTC ratio, actively finding a bid.
- Fundamental supply picture even better than BTC.
- Call spreads are attractive in terms of low overall vol and historically steep (expensive) ∆25 wing (to sell).
- ETH Spot ETF speculation rally as the deadline approaches.
- Everyone who missed the BTC move is looking for “the next best thing”.

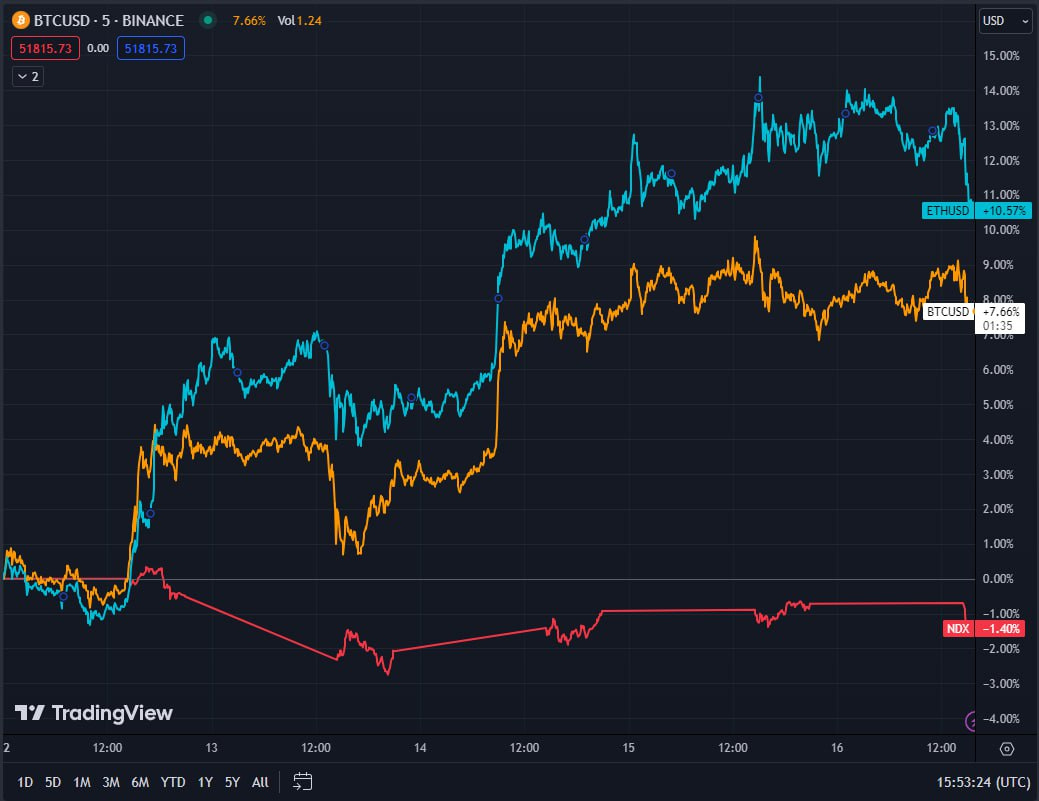
Paradigm's Week In Review
BTC +7.7% / ETH +10.6% / NDX -1.4%
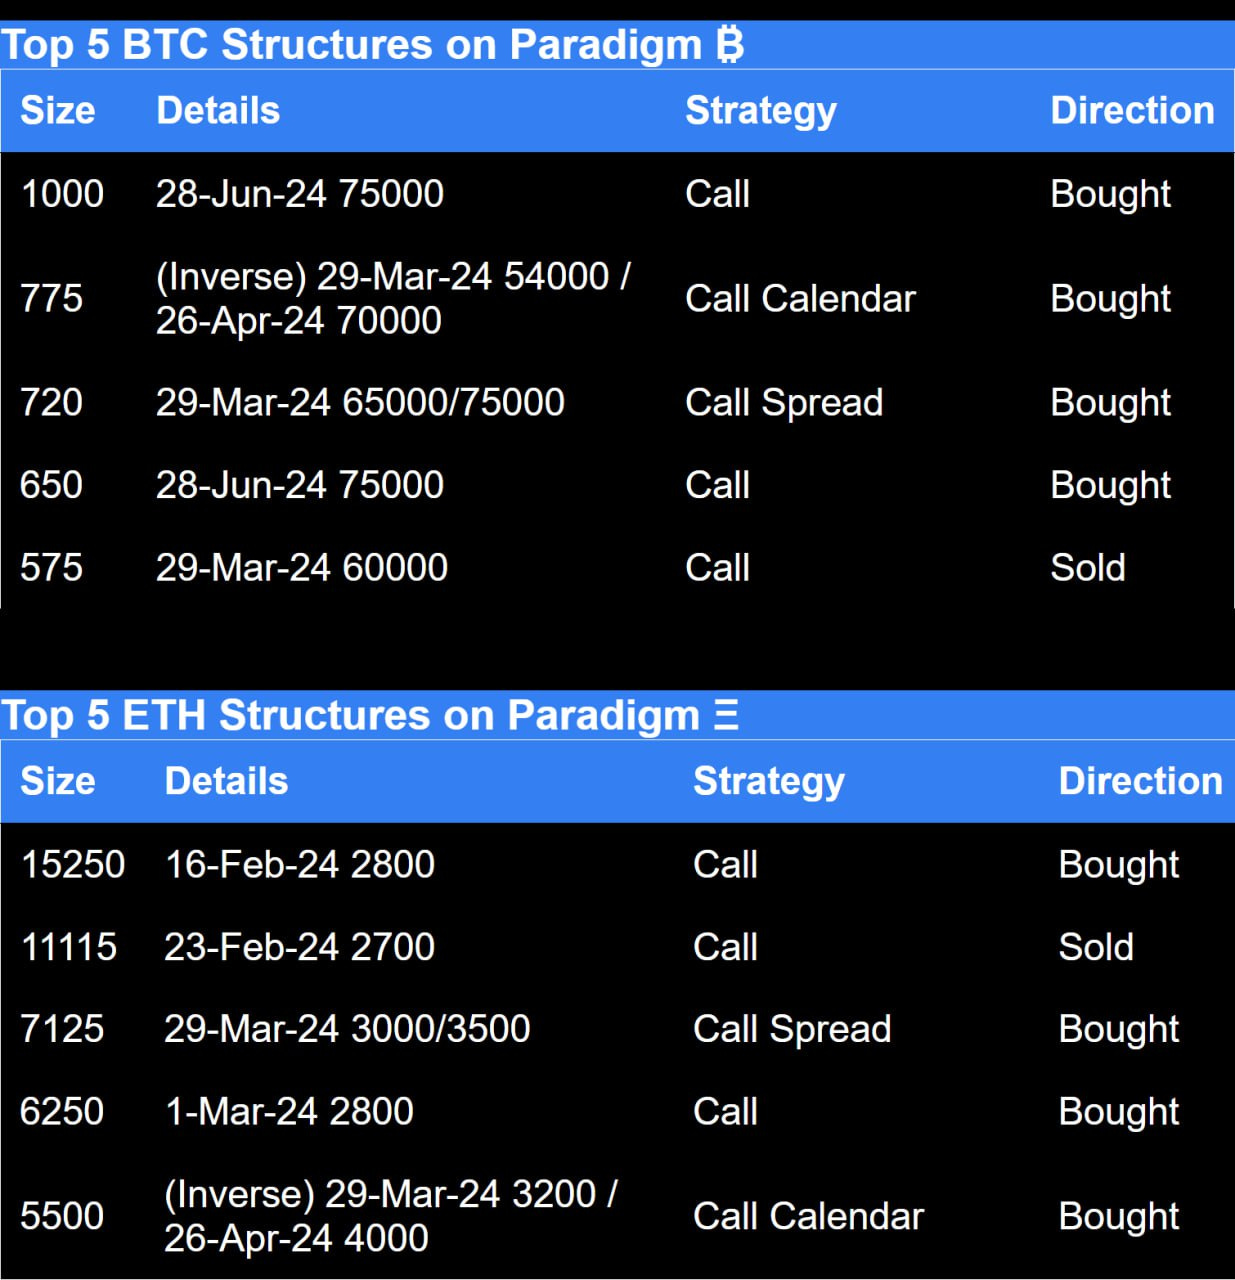
Paradigm Top Trades this Week 👇
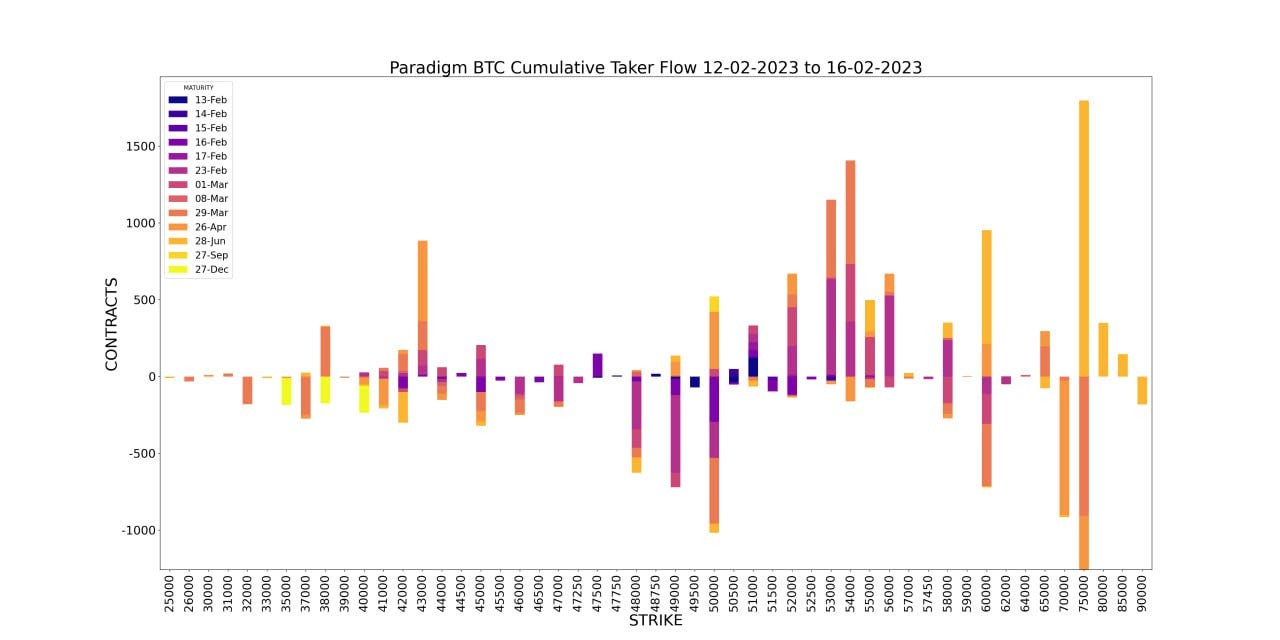
Weekly BTC Cumulative Taker Flow 🌊
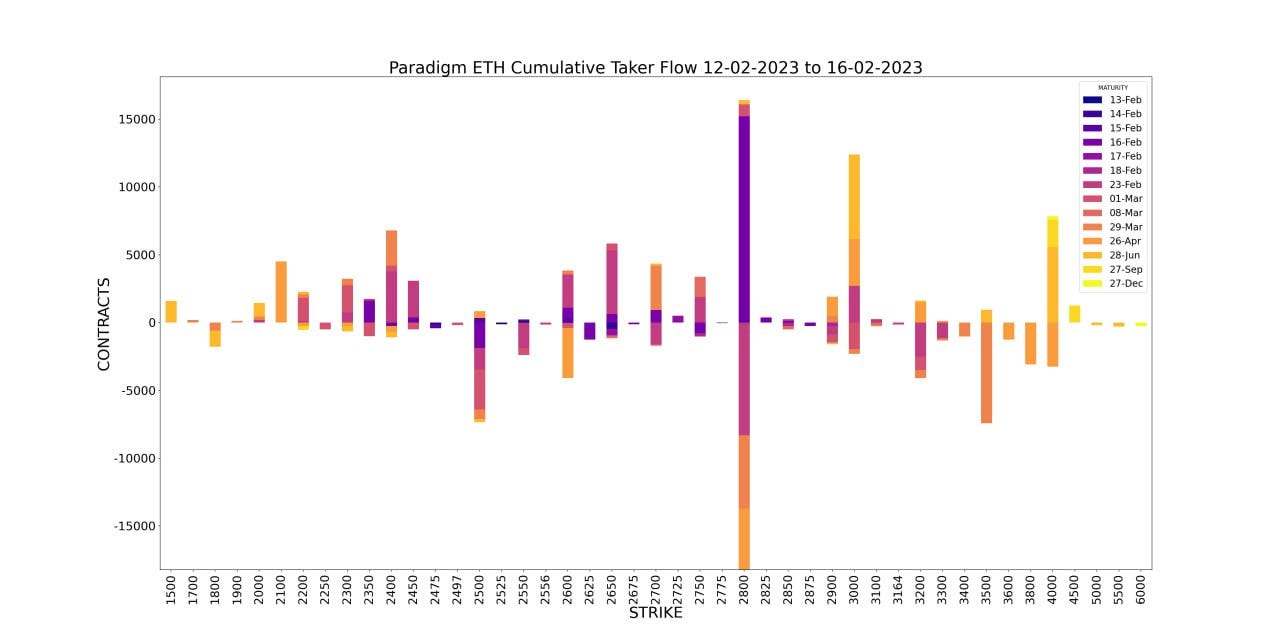
Weekly ETH Cumulative Taker Flow 🌊
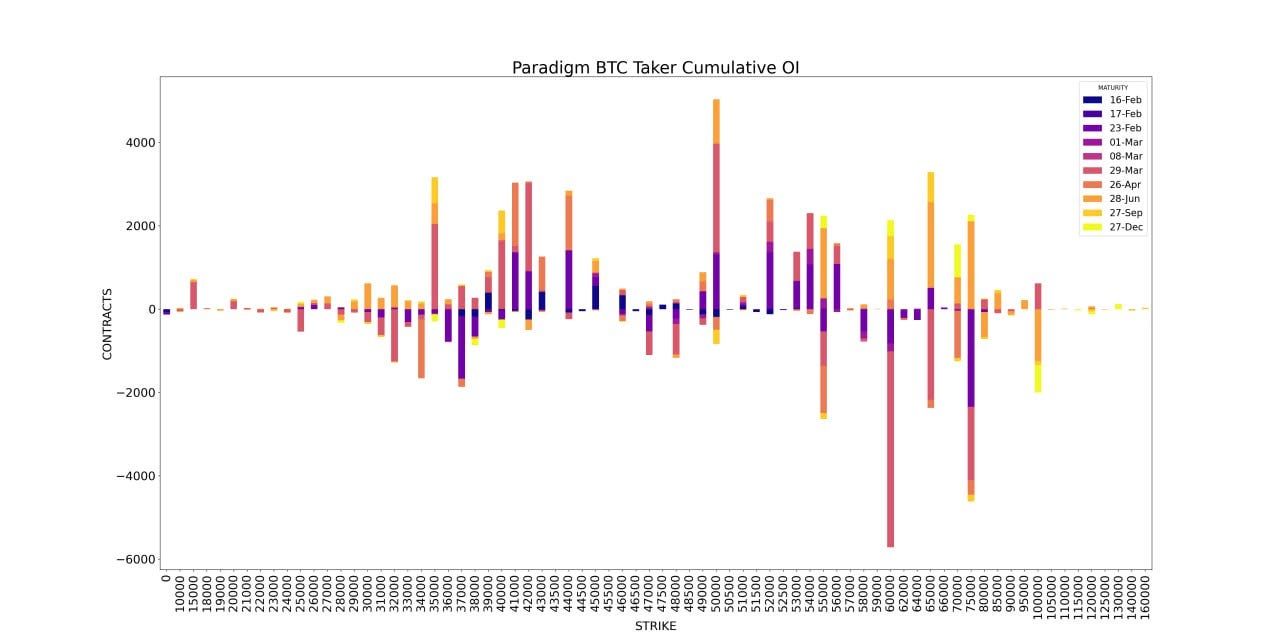
BTC Cumulative OI
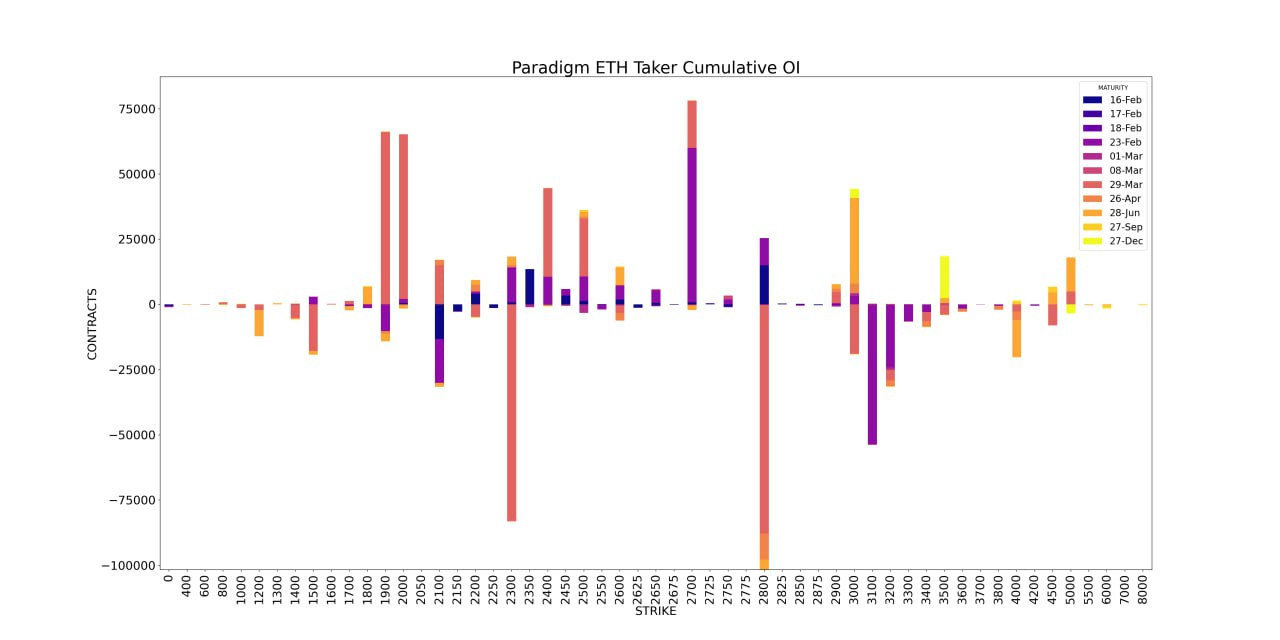
ETH Cumulative OI
As always you can hit us up from the below
Hit us up on Telegram! 🙏
Paradigm Edge: Daily Commentary✍️ http://pdgm.co/edge
24/7 Support: http://pdgm.co/tgsupport
Sign up now! 👉 https://pdgm.co/3BLEw1Y
BTC
ETH

The Squeethcosystem Report
Crypto markets had quite a week. ETH ended the week +10.74%, oSQTH ended the week +23.30%.
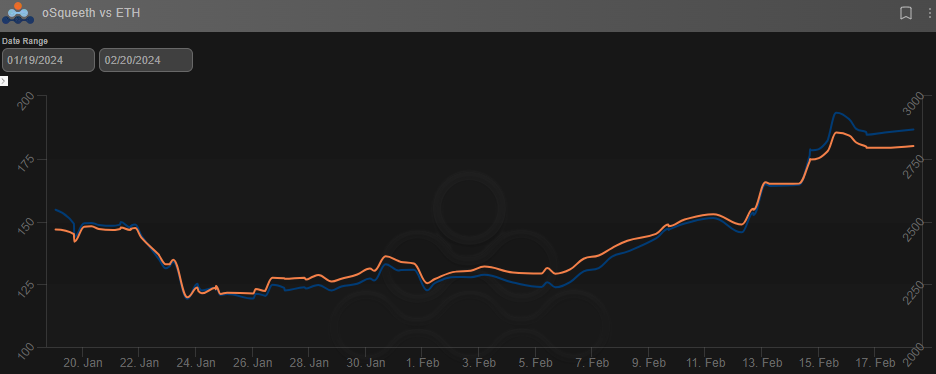
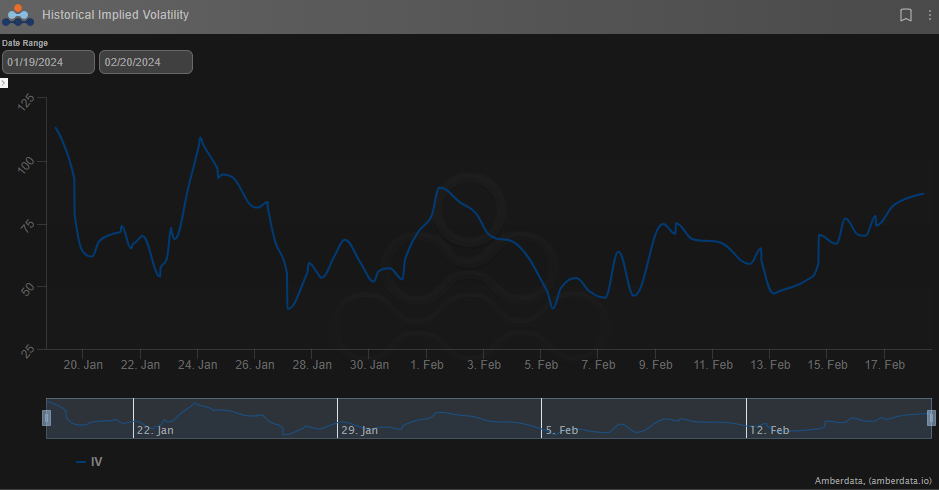
Volatility
oSQTH IV remained active this week, trading down to the 40s before settling in the 80s.
Volume
The 7-day total volume for oSQTH via Uniswap oSQTH/ETH pool was $1.15m
February 13th saw the most volume, with a daily total of $877.41k traded.
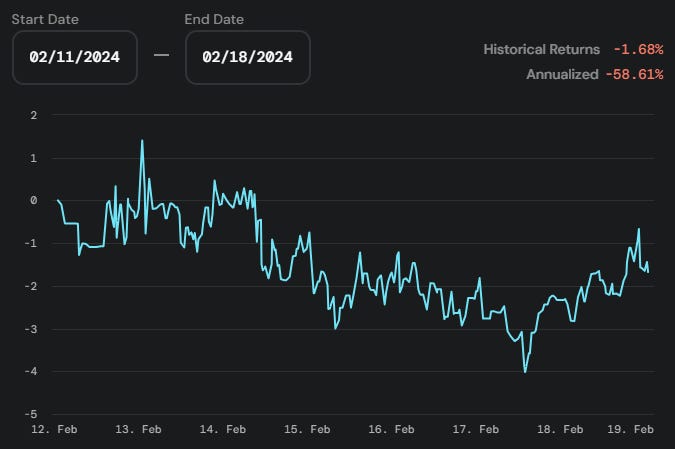
Crab Strategy
Crab saw declines ending the week -1.68% in USDC terms.
Twitter: https://twitter.com/opyn
Discord: discord.gg/opyn
AMBERDATA DISCLAIMER: The information provided in this research is for educational purposes only and is not investment or financial advice. Please do your own research before making any investment decisions. None of the information in this report constitutes, or should be relied on as a suggestion, offer, or other solicitation to engage in, or refrain from engaging, in any purchase, sale, or any other investment-related activity. Cryptocurrency investments are volatile and high risk in nature. Don't invest more than what you can afford to lose.
