Share this blog:

USA Week Ahead:
-
Tuesday 8:30am - CPI
-
Thursday 8:30am - Jobless Claims, Retail sales, Empire Manu.
-
Friday 8:30am - PPI
Disclaimer: Nothing here is trading advice or solicitation. This is for educational purposes only.
Authors have holdings in BTC, ETH, and Lyra and may change their holdings anytime.
![]()
MACRO THEMES:
Stocks closed above 5k for the first time in the S&P500. The US economy has proven resilient despite the historically fast hikes for US rates.
Last week, as the S&P 500 marched higher, US bonds continued to crash as the latest employment report was the catalyst to send prices lower.
Chart: (S&P 500 via finviz.com)
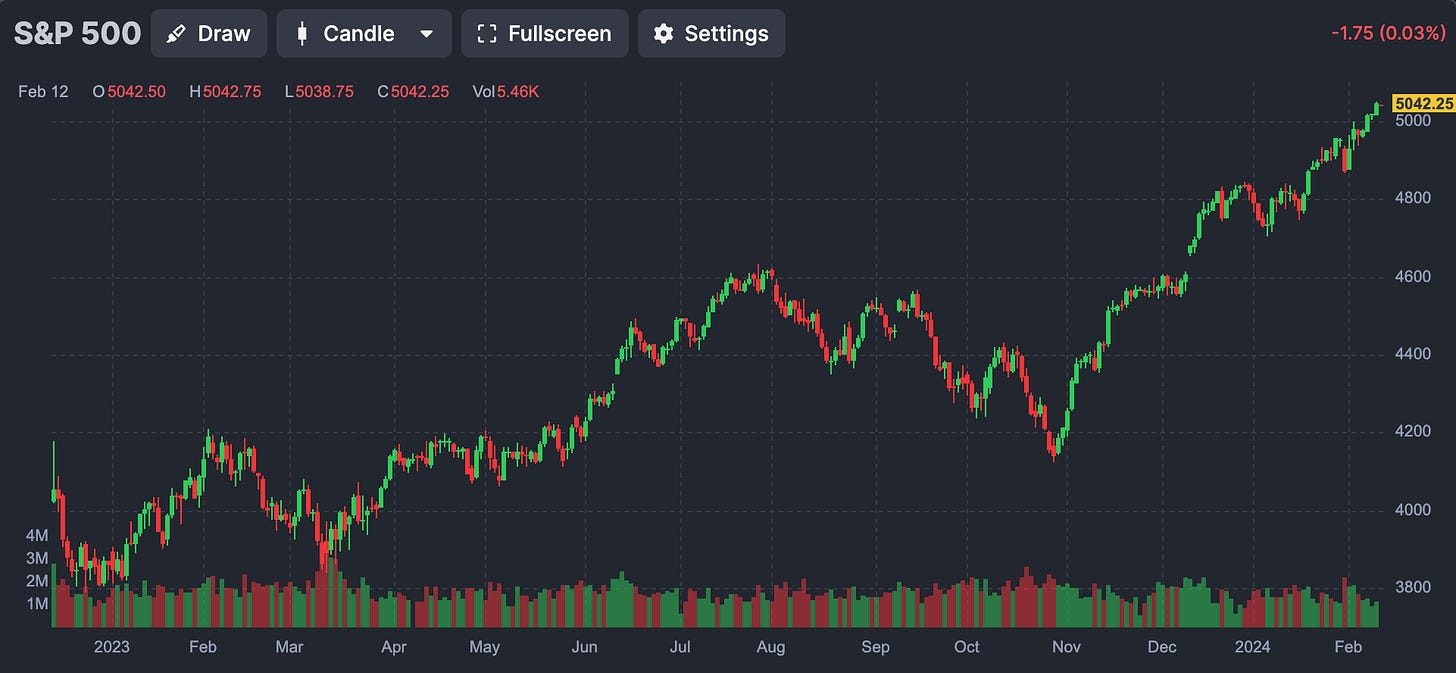
Chart: (US Treasury Yield curve via ustreasuryyieldcurve.com)
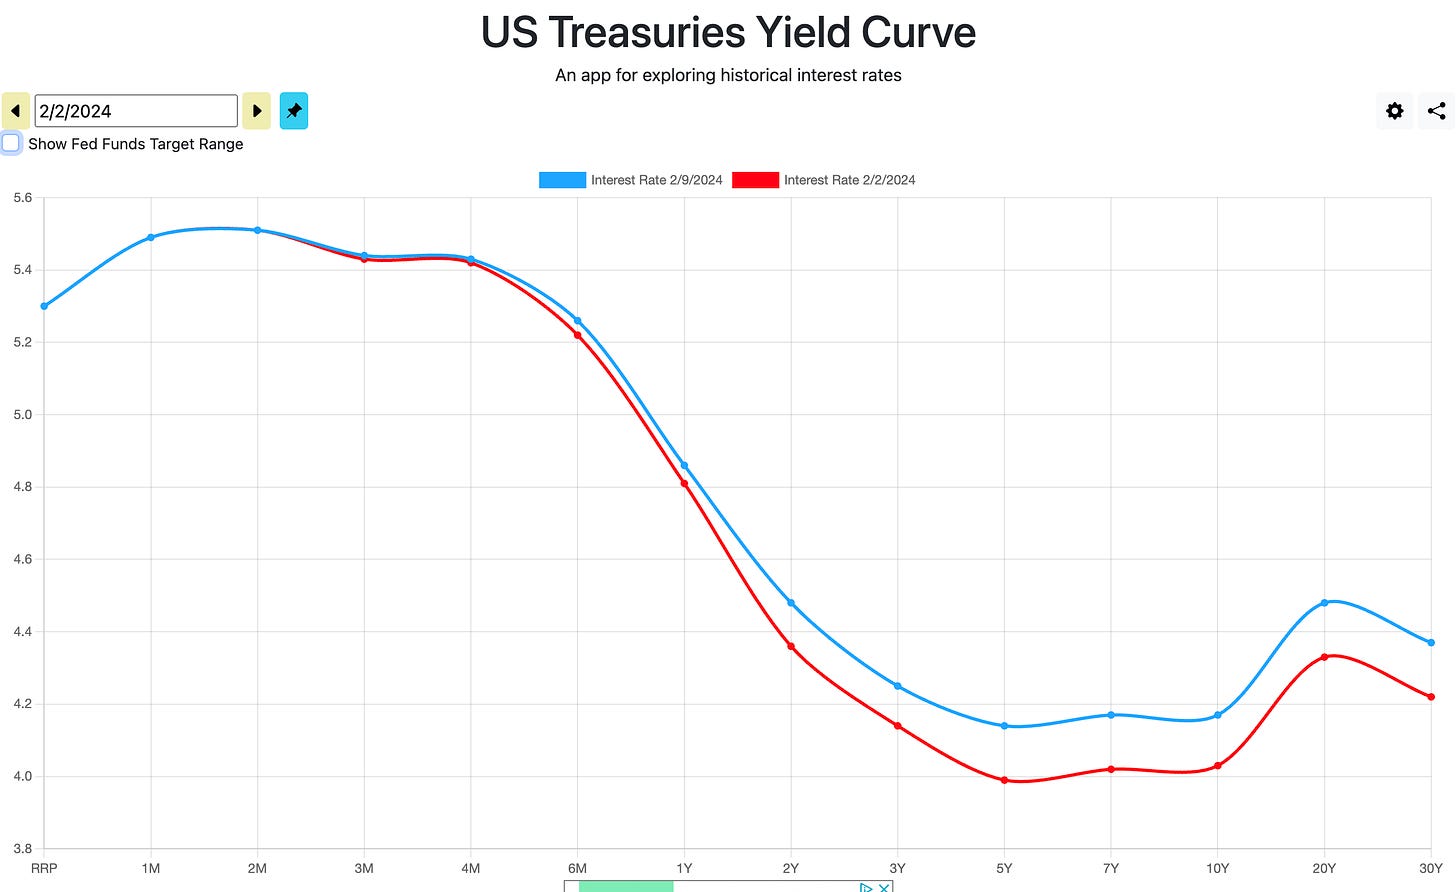
We can see that longterm yields rose higher week-over-week, while the front-end of the yield curve remains stable.
This week we have CPI and PPI data to help gauge the trend for bond prices going forward.
Chart: (WSJ.com)
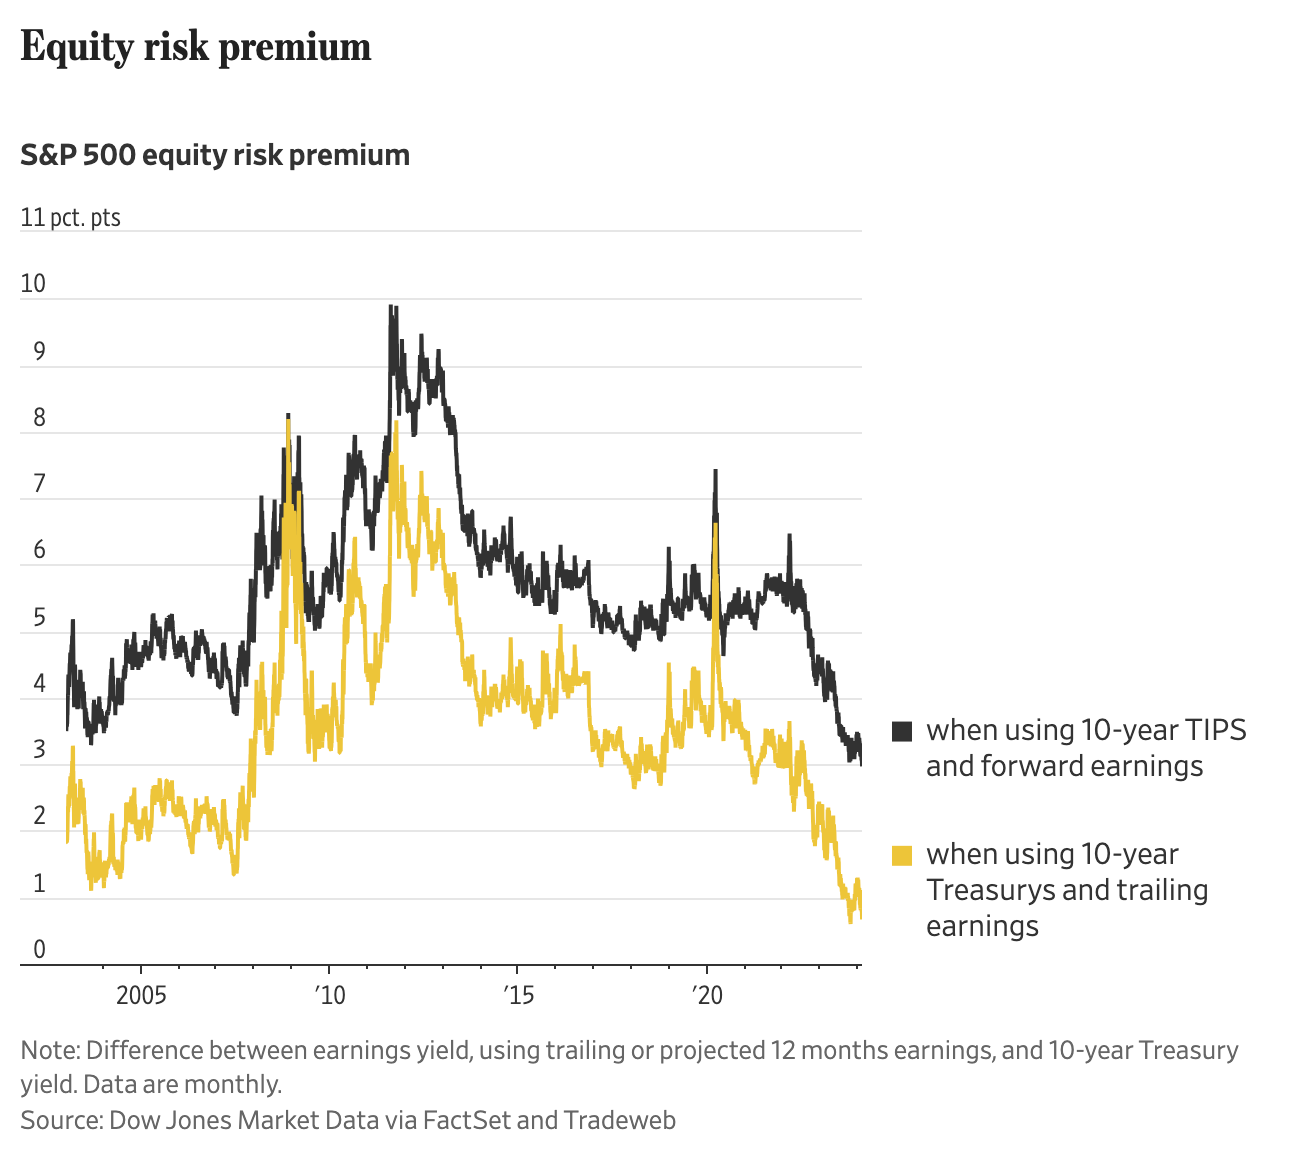
Looking at the equity risk premium which compares risk-free 10-year yields against projected annual corp earnings growth, we can see that stocks are expensive (or treasuries are cheap) given this measure.
Another way to read this, is that risk-on sentiment is very strong in the market.
The big driver of higher index prices is due to tech stocks like NVDIA which are pricing in an AI boom, up +45% YTD.
Chart: (NVDA weekly stock chart via finviz.com)
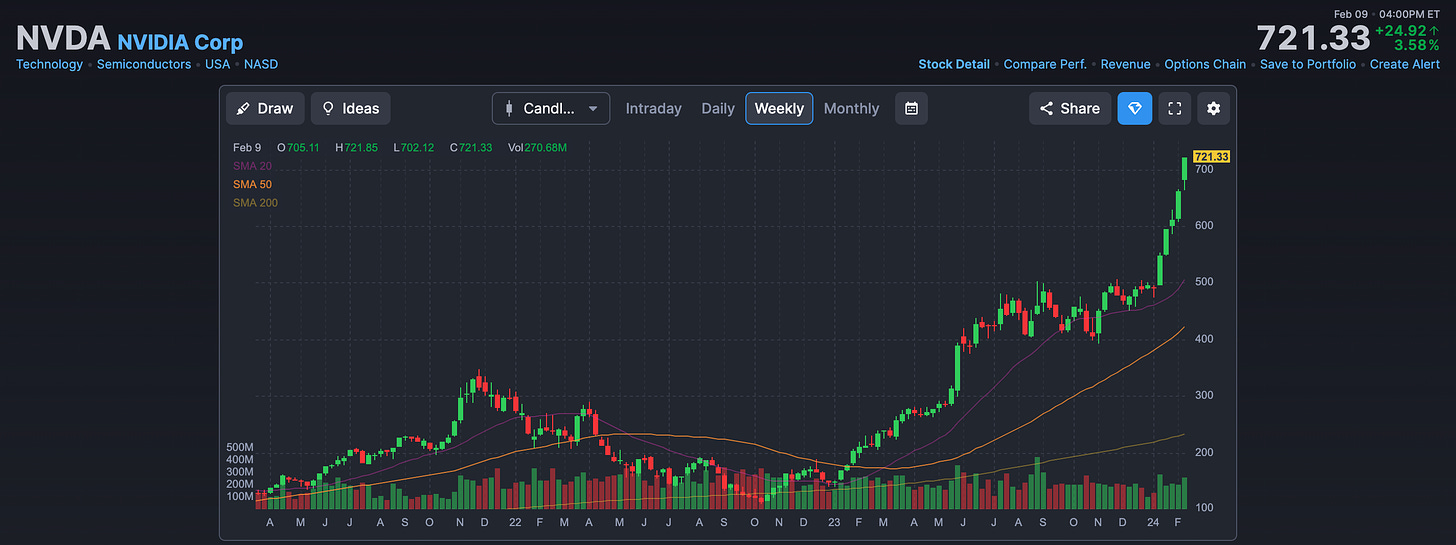
It’s hard to say that AI is overvalued. We’re really at the beginning of the AI story and an explosion of adoption. How do you value the future of AI? It’s definitely unknown in my opinion.
Crypto is in a similar position. Likely a compliment to AI technology given decentralized on-chain data assets and the unknowable future use cases.
This investor risk appetite for tech is good for crypto and vice versa.

BTC: $48,087 (+13.1% / 7-day)
ETH :$2,500 (+9.4% / 7-day)
SOL :$107.38 (+12.3% / 7-day)
Chart: (Bitcoin ETF Flows, in BTC Terms)
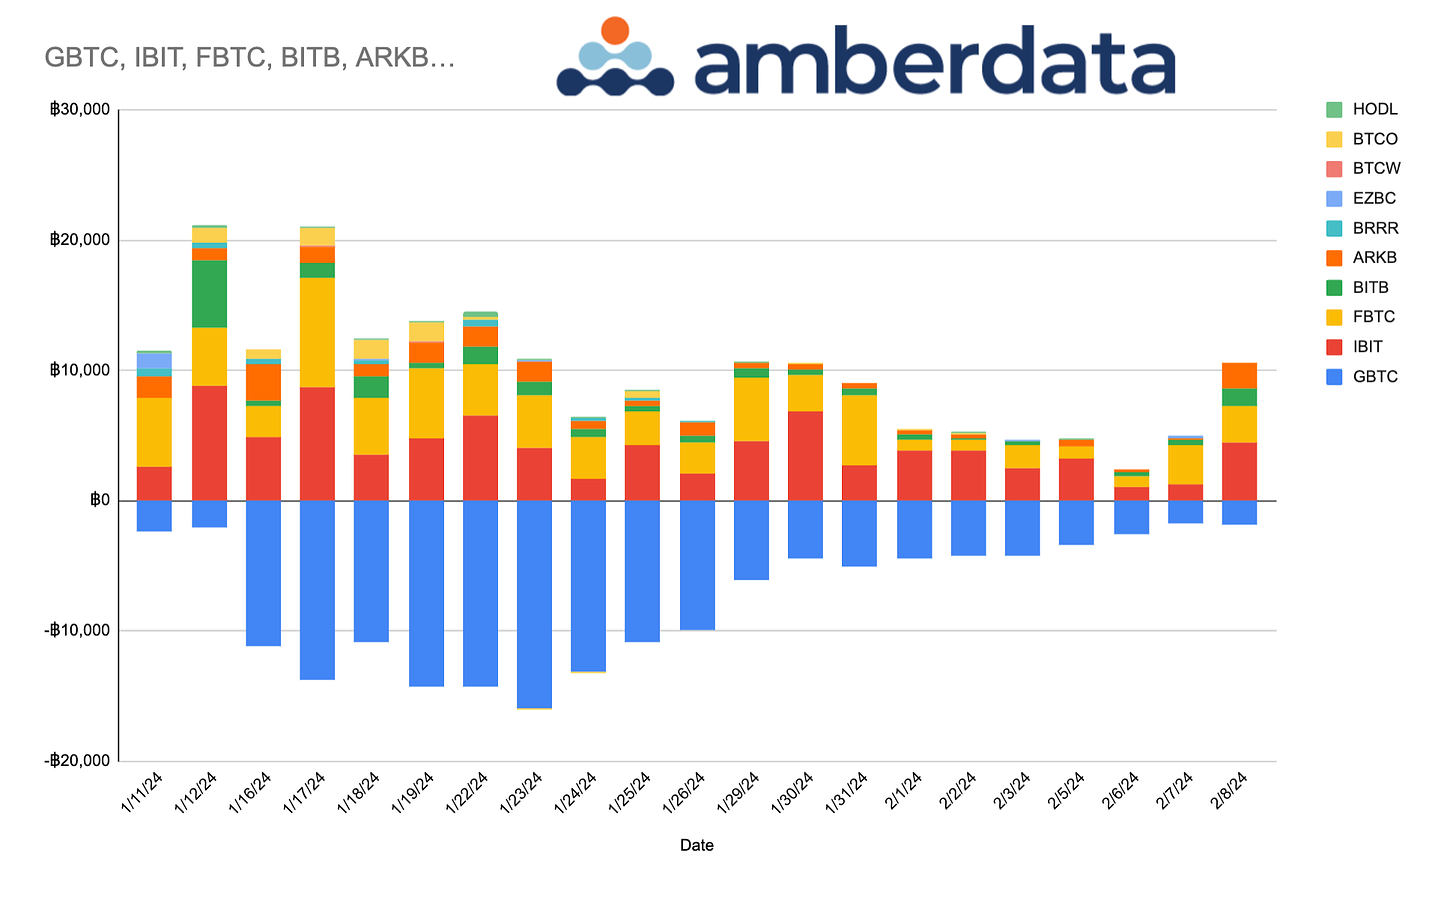
We continue to see very constructive behavior in terms of BTC ETF flows. GBTC outflows are consistently diminishing. I could even see GBTC flip back into inflow territory soon.
The other ETFs saw massive inflows late last week, altogether this has been very bullish for BTC spot prices.
Traditionally, BTC bull markets are often categorized with periods of FOMO. Meaning as prices make new highs, side-lined money fears missing out and higher BTC prices actually ATTRACT more buying.
What does this phenomenon look like now that US retail investors and financial advisor now have a direct, straightforward and easy way to invest into BTC…?
Mega-Fomo?
Chart: (BTC ATM Term Structure)
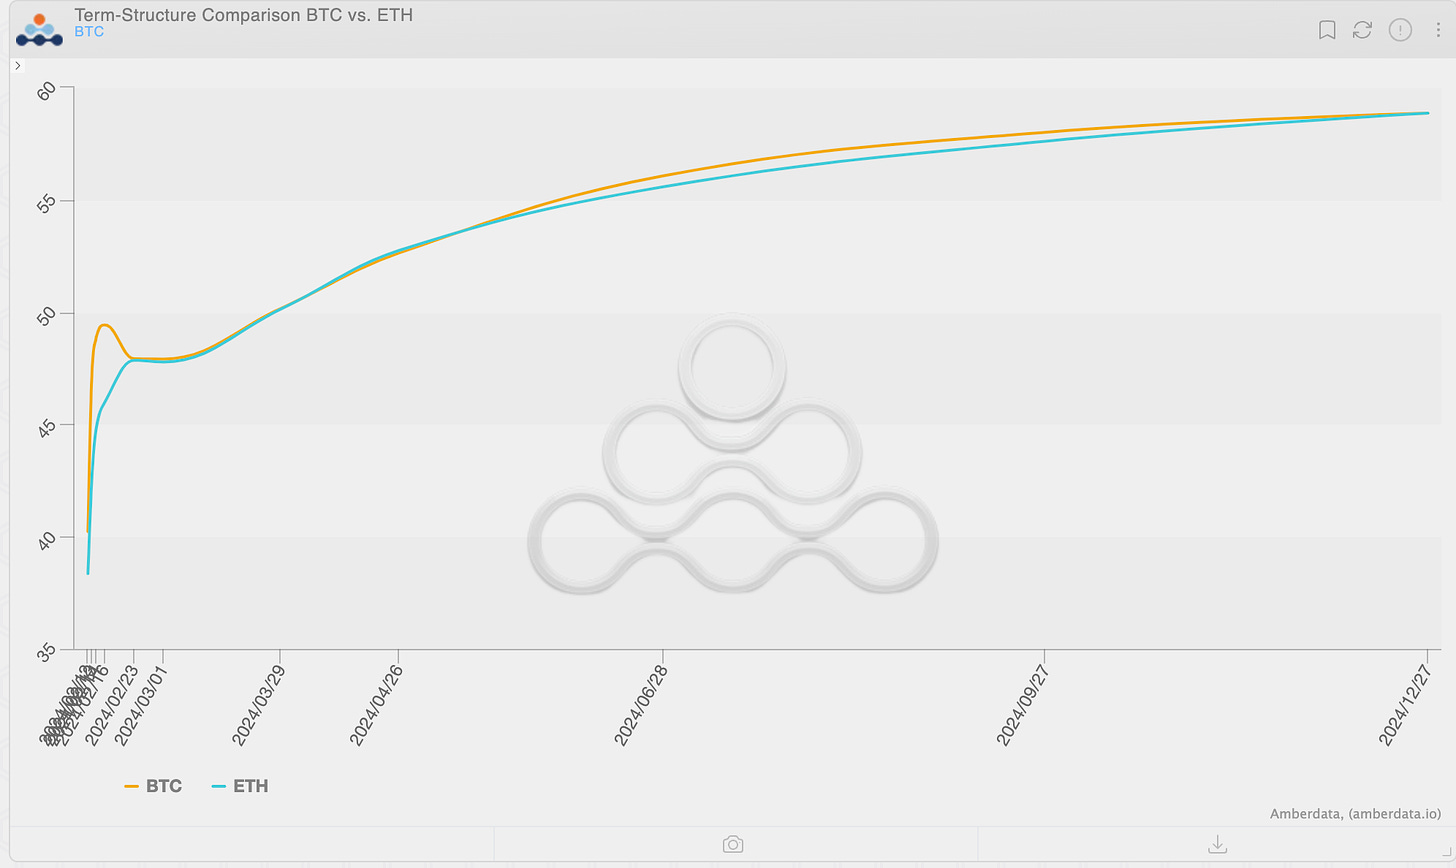
We’re seeing a nice little bump higher in short-dated volatility due to this rally, but this is NOT FOMO territory yet. Should we actually see a FOMO move higher in prices, I’d look for extended backwardation across the ENTIRE curve.
Meaning expirations like 3/29 IV would exceed Dec 2024 IV… that’s +10pts higher in IV. This is what we’re looking for!
Chart: (BTC historical Term Structure Richness)
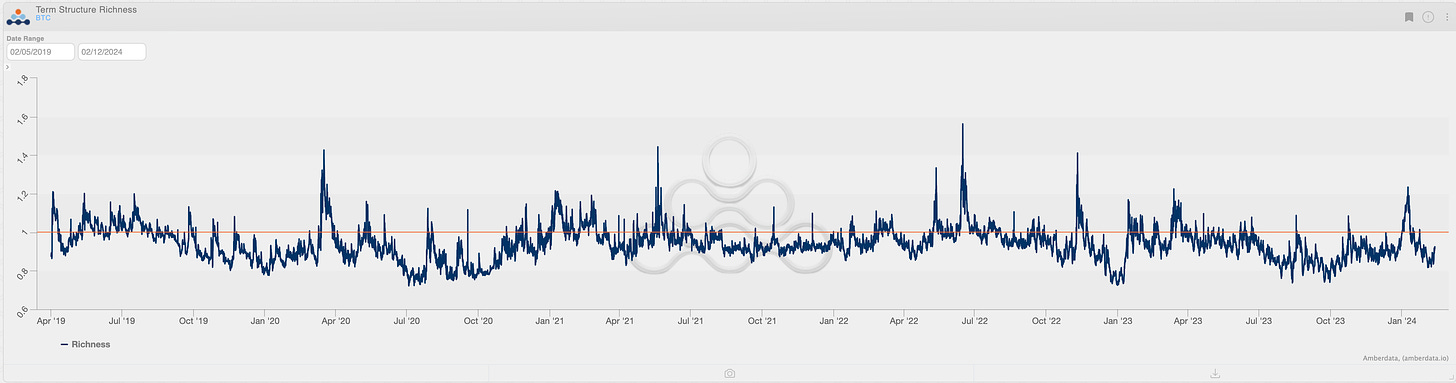
We can see there’s definitely more room to run higher for short-dated option volatility. Getting above the 1.00 line is expected.
Chart: (BTC Spot prices via Finviz.com)
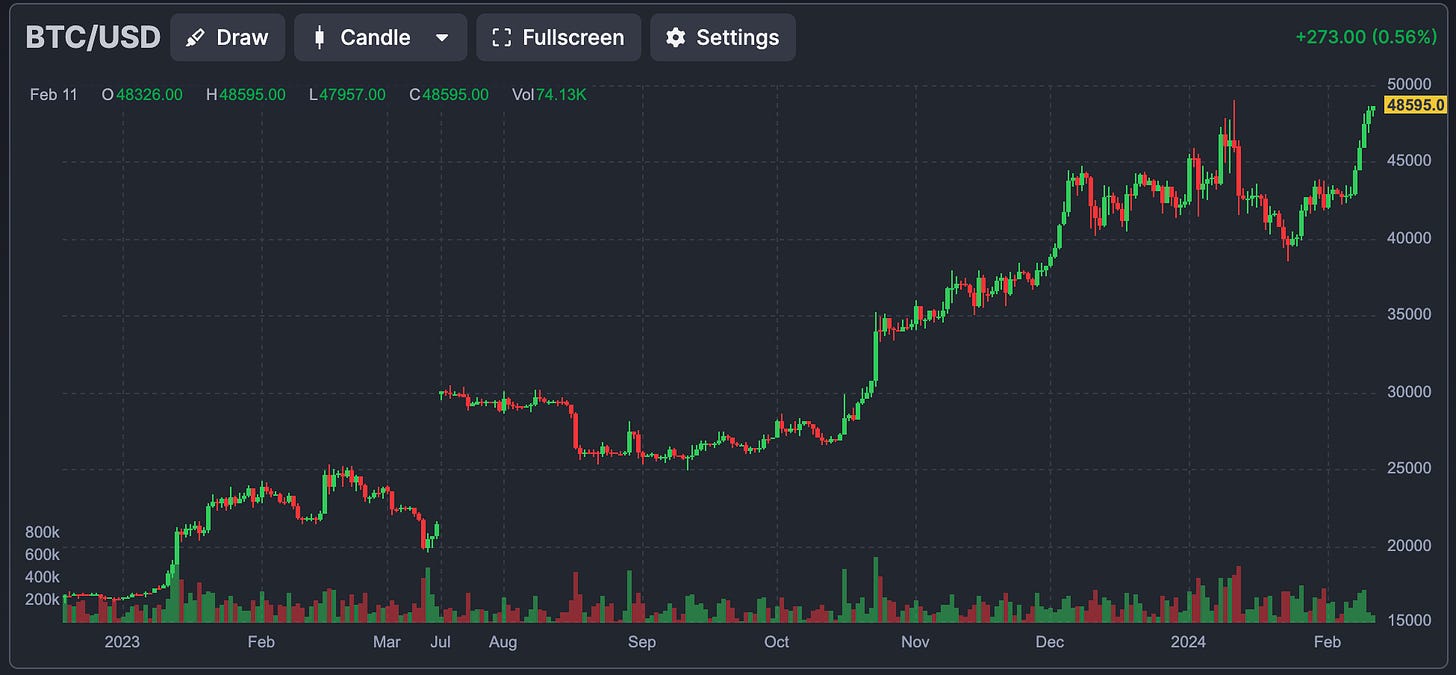
In terms of spot price action… Right now, we’re right at the SPOT ETF high. This is a significant level. This chart has a lot of momentum higher, we’re likely to blast through that level.
The next significant level is the $1T market cap level. This is BTC price of about $50,900.
Given this momentum, I could see BTC trade that level this week!
Chart: (Feb 22nd - BTC volatility distribution given 48% IV input)
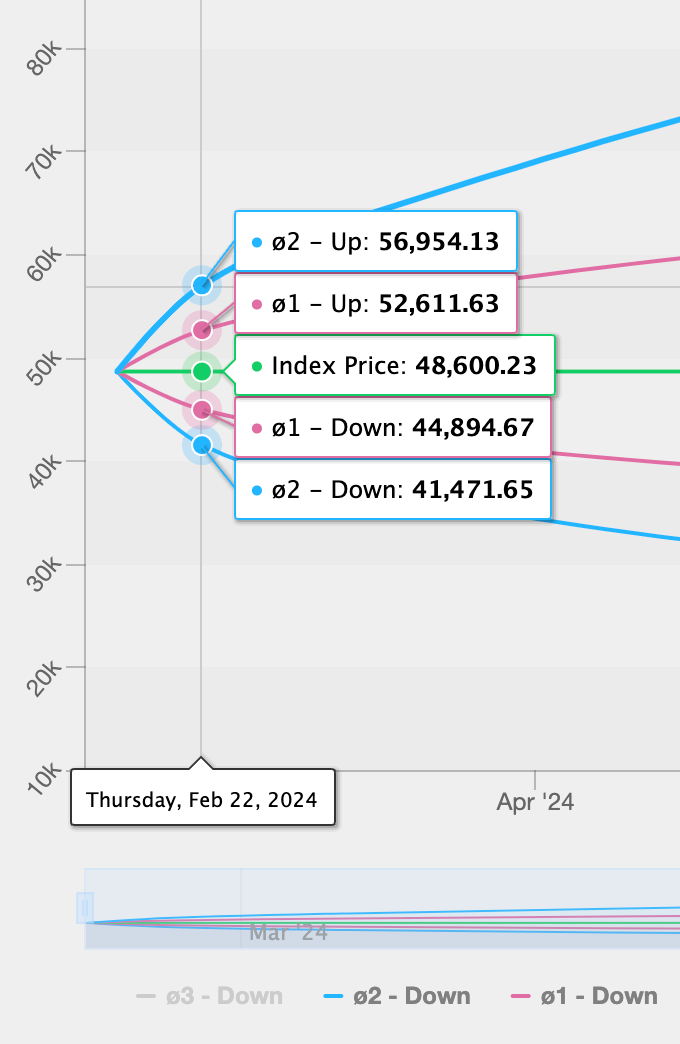
Looking at the current volatility implied distribution iwth 48% IV, this is absolutely reasonable and in-line.
Although, I expect vol. itself to move higher and the term structure to invert if we reach $50,900 this week… Just from demand for upside paper and optionality.
That type of flow could become interesting for a set-up (if we get it).
Chart: (BTC ∆25 RR-Skew)
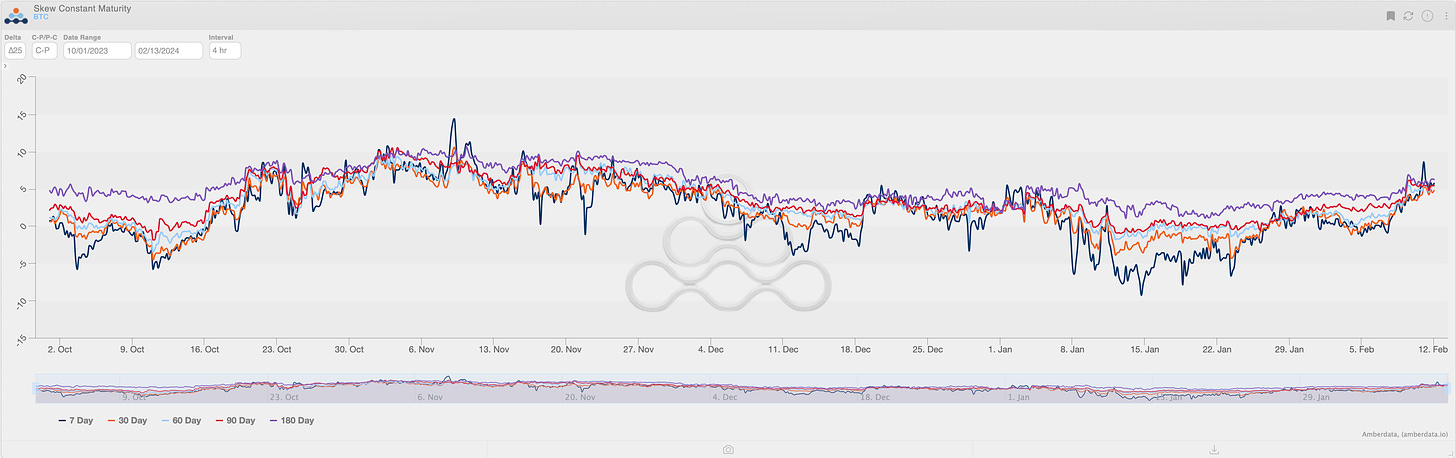
Options skew is nearing levels seen in mid-October as BTC broke above the $30k mark.
Trader’s are positioning for a move higher and they’re using the $50k strike to do it.
Currently the $50k strike is the most popular option purchased by the street.
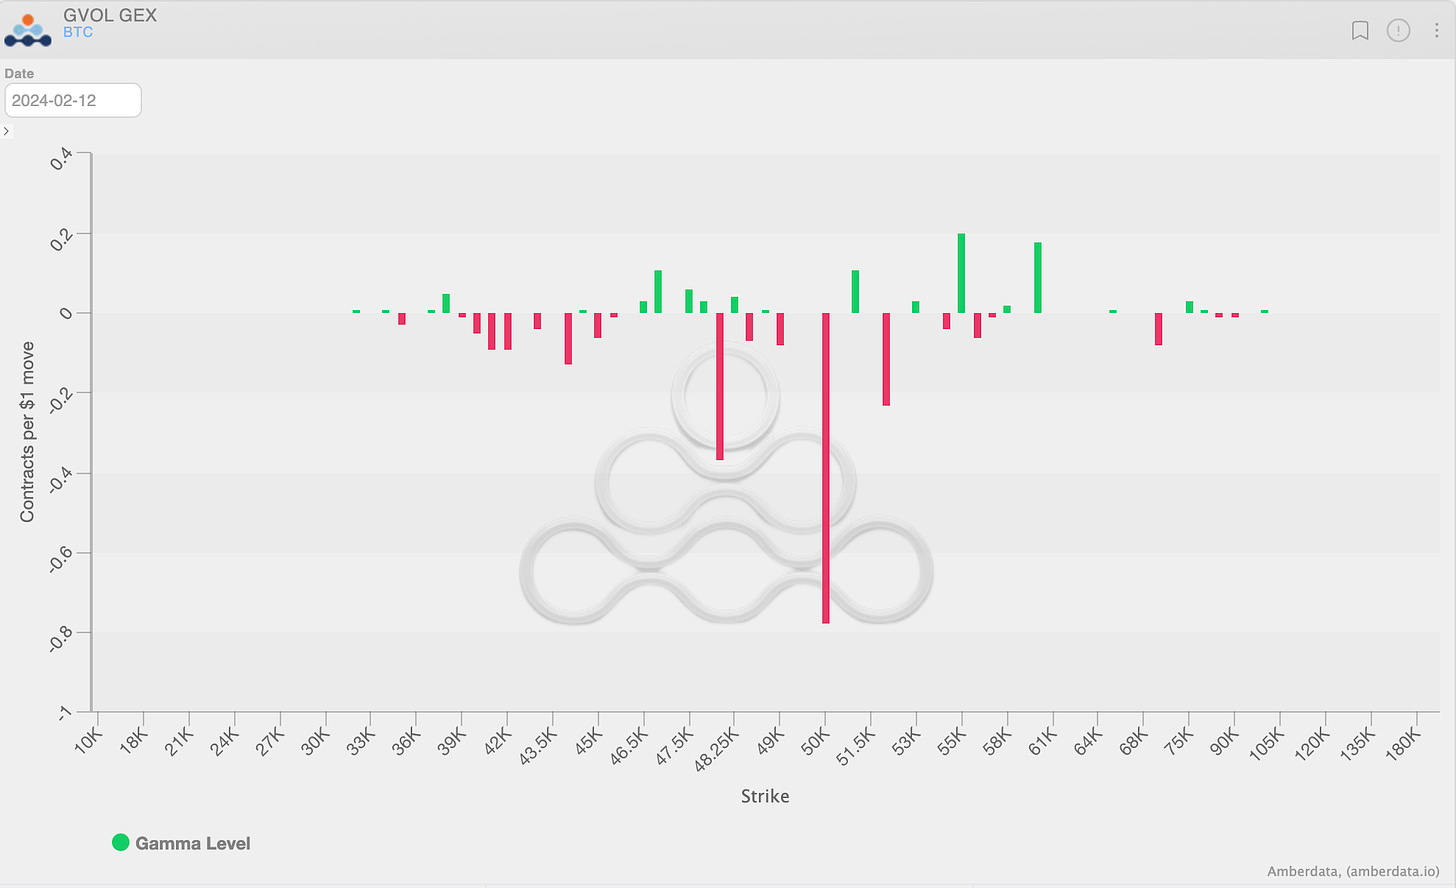
Chart: (BTC Dealer Gamma profile)

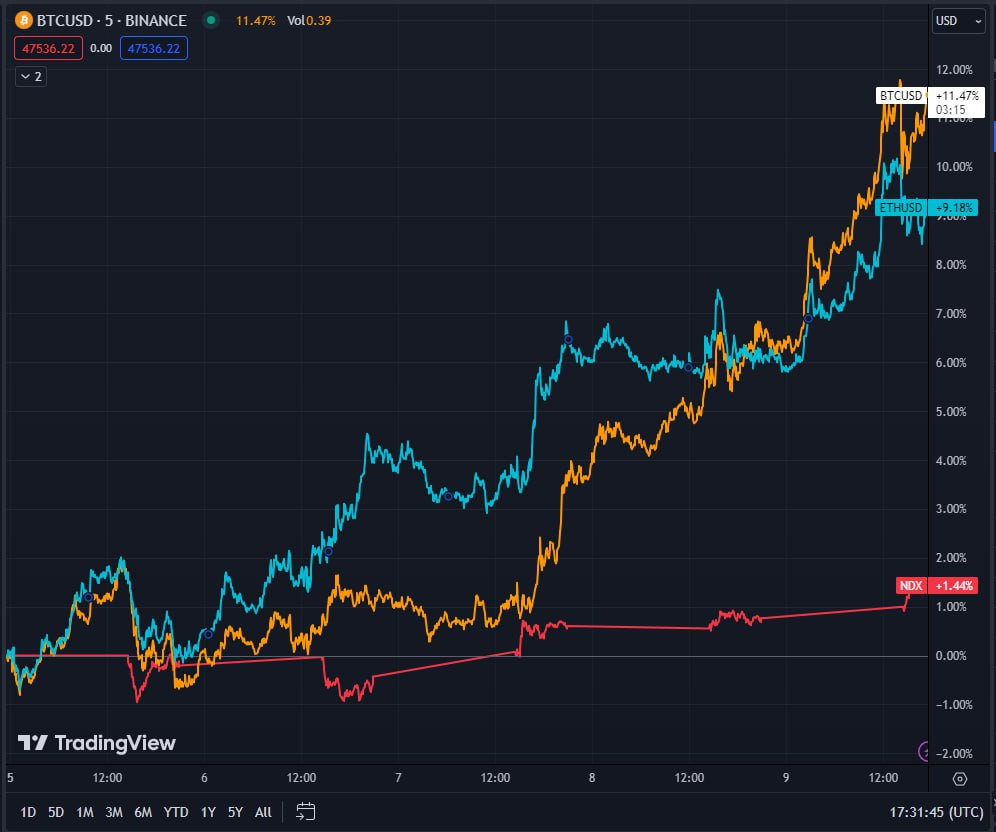
Paradigm's Week In Review
BTC +11.5% / ETH +9.2% / NDX +1.4%
Paradigm Top Trades this Week 👇
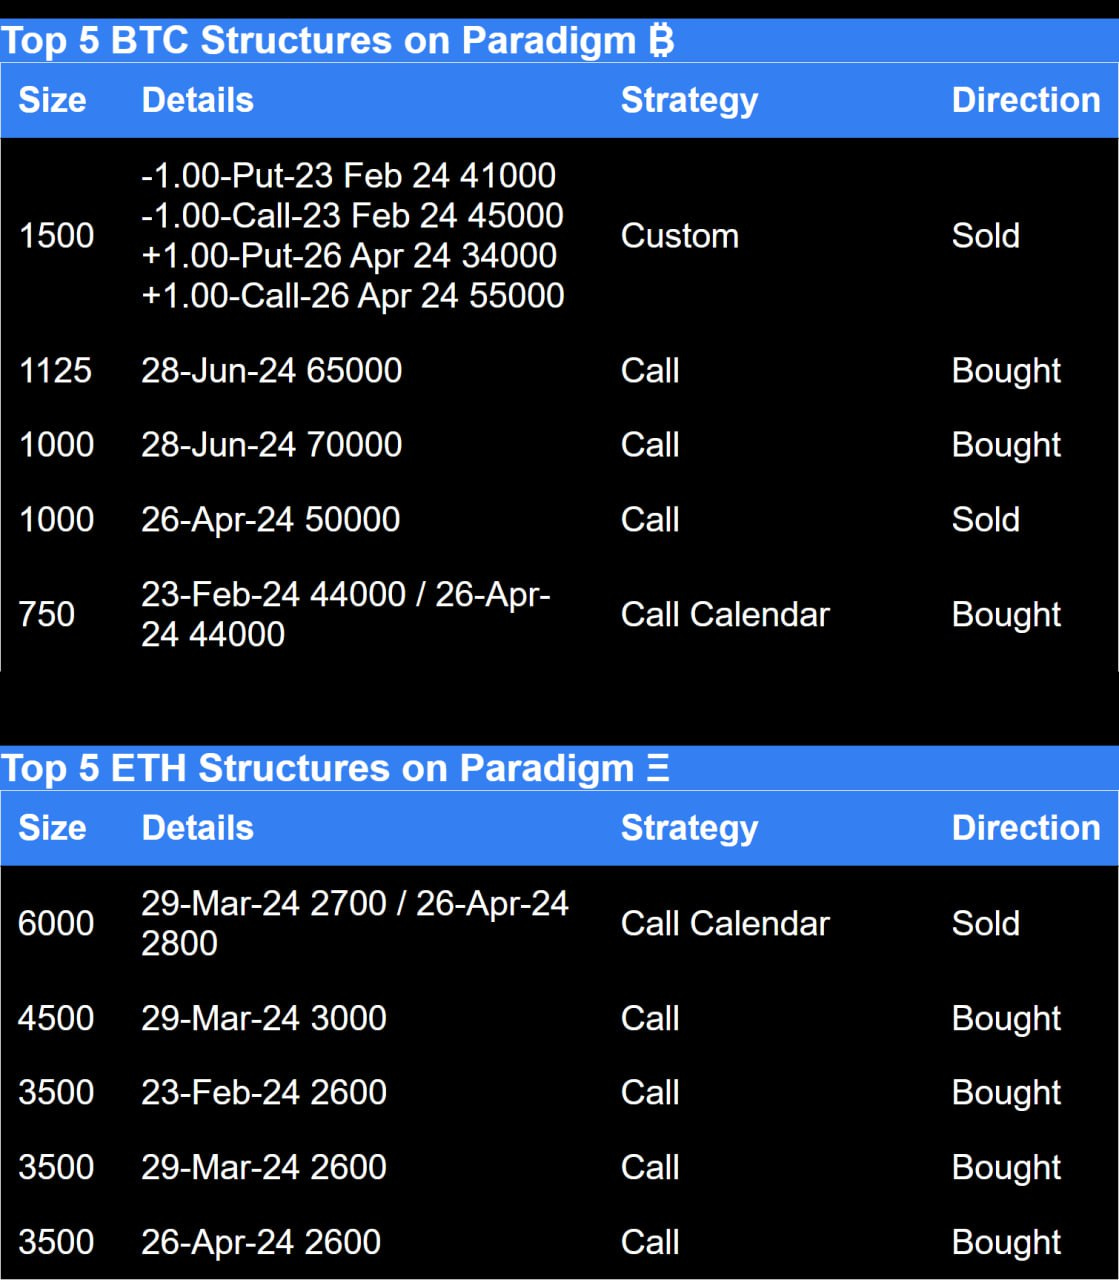
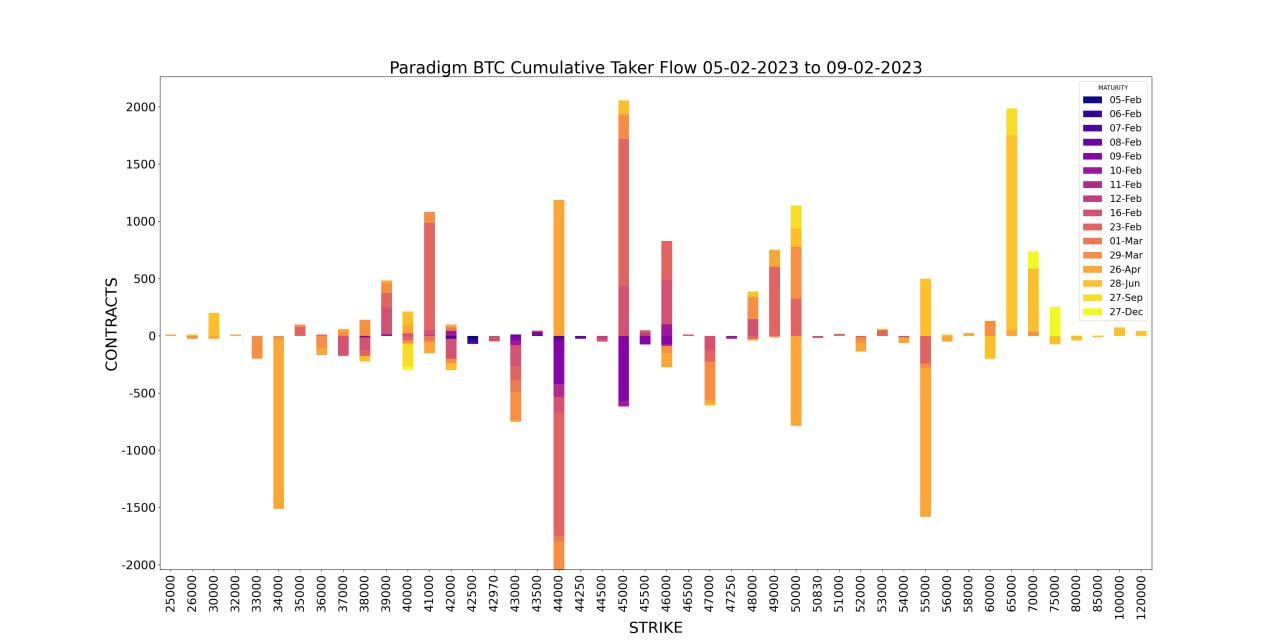
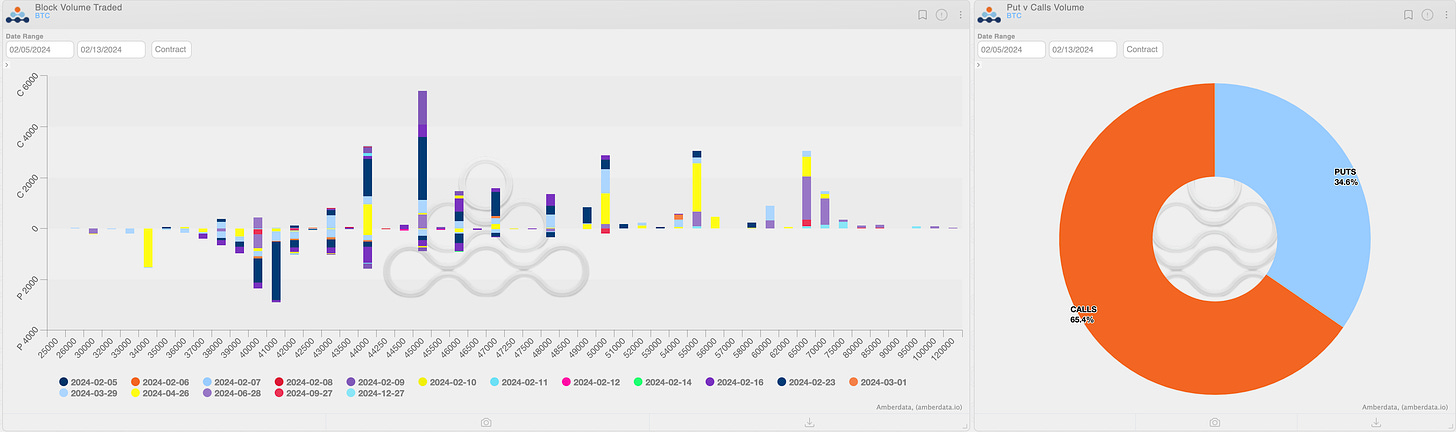
Weekly BTC Cumulative Taker Flow 🌊
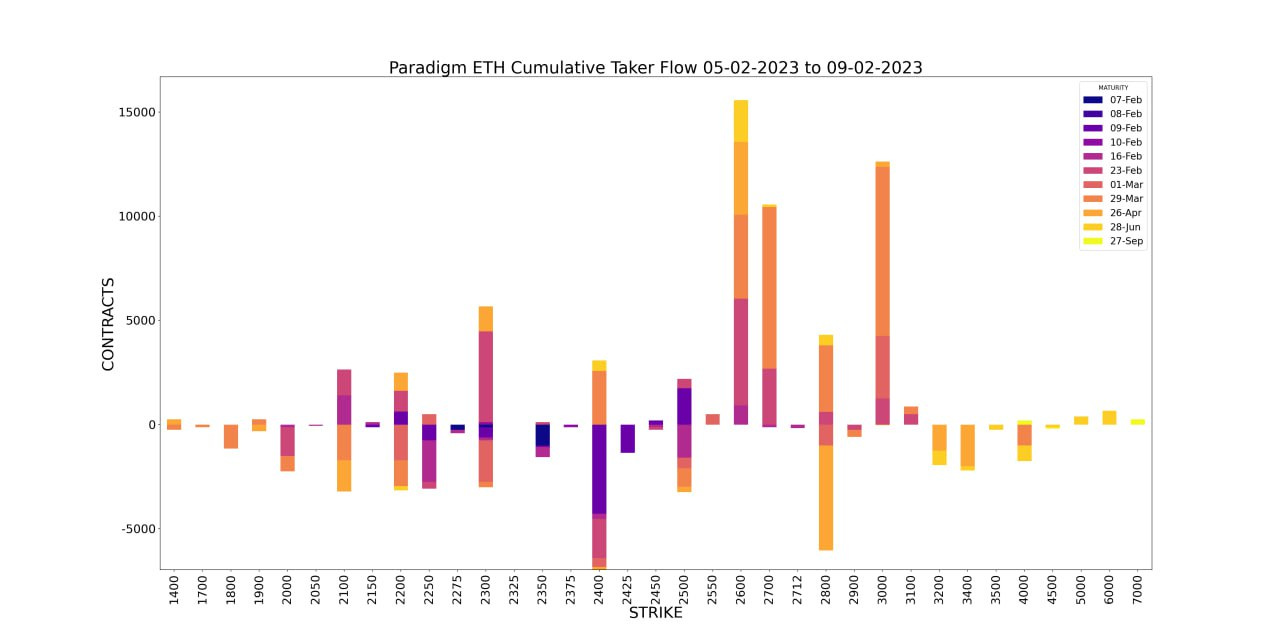
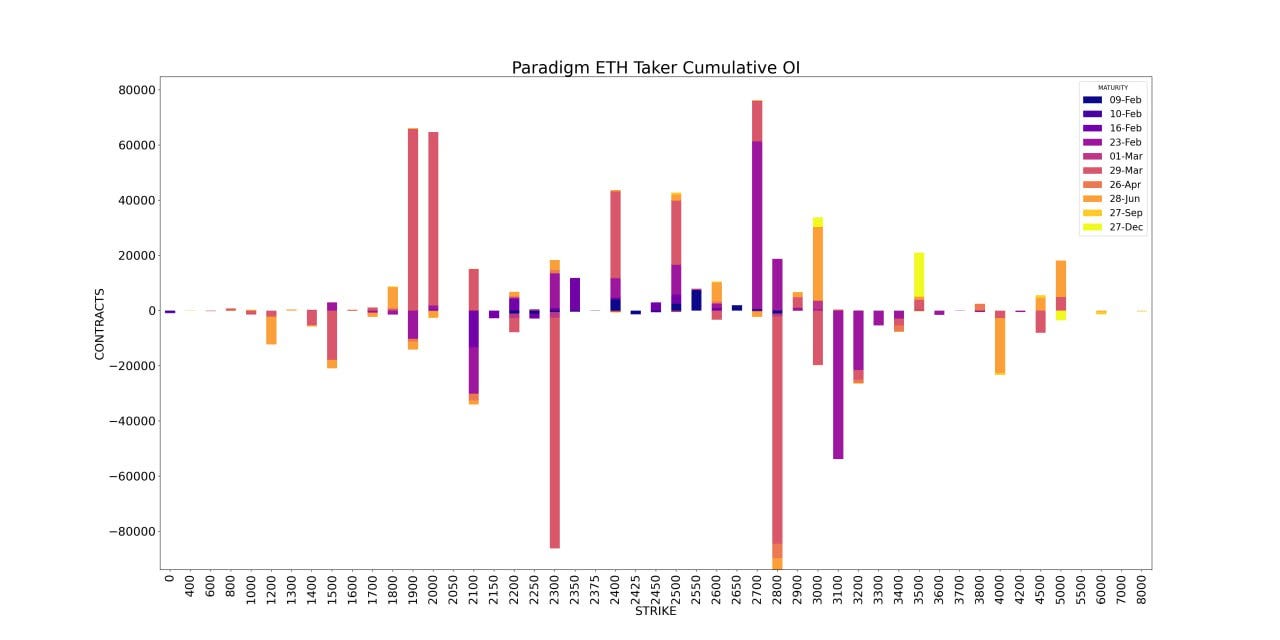
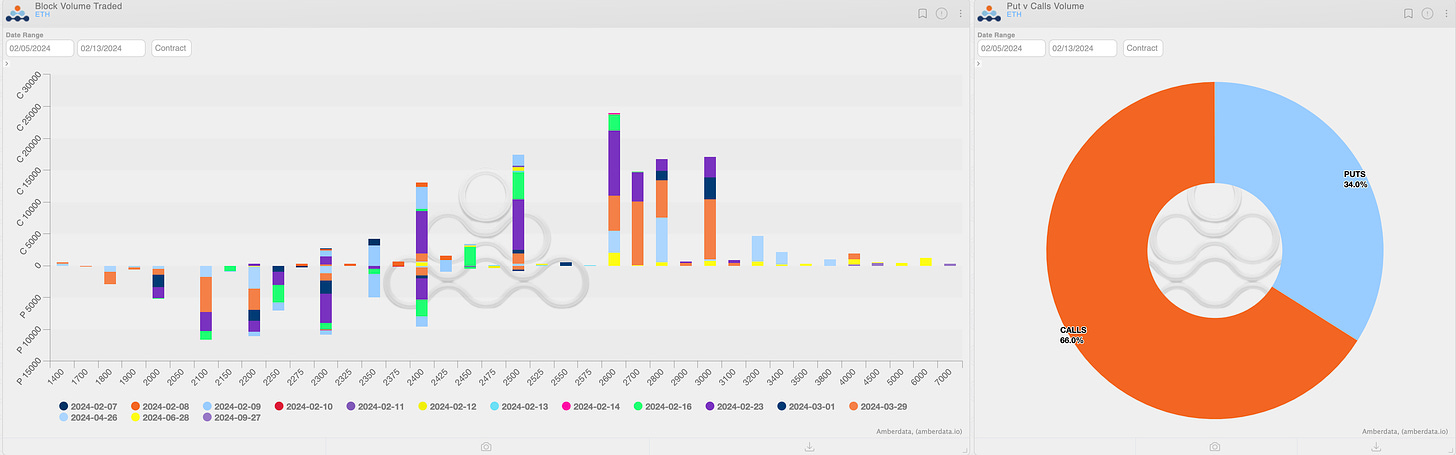
Weekly ETH Cumulative Taker Flow 🌊
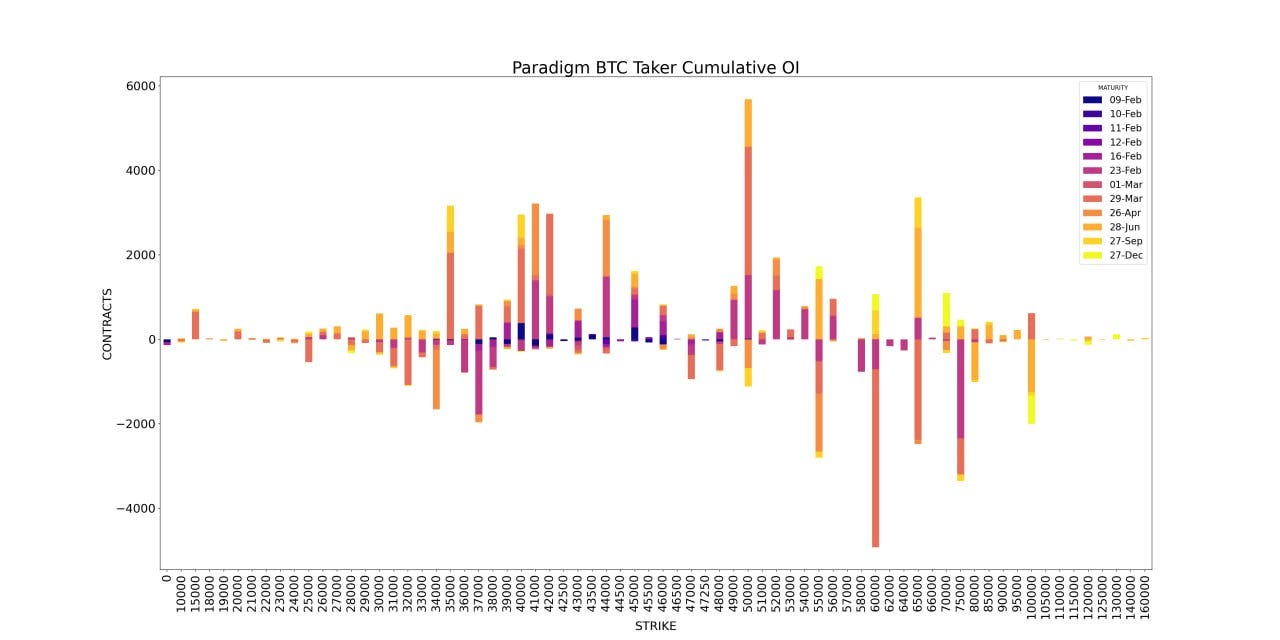
BTC Cumulative OI
ETH Cumulative OI
As always you can hit us up from the below
Hit us up on Telegram! 🙏
Paradigm Edge: Daily Commentary✍️ http://pdgm.co/edge
24/7 Support: http://pdgm.co/tgsupport
Sign up now! 👉 https://pdgm.co/3BLEw1Y
BTC
ETH

The Squeethcosystem Report
Crypto markets had quite a week. ETH ended the week +10.10%, oSQTH ended the week +20.46%.
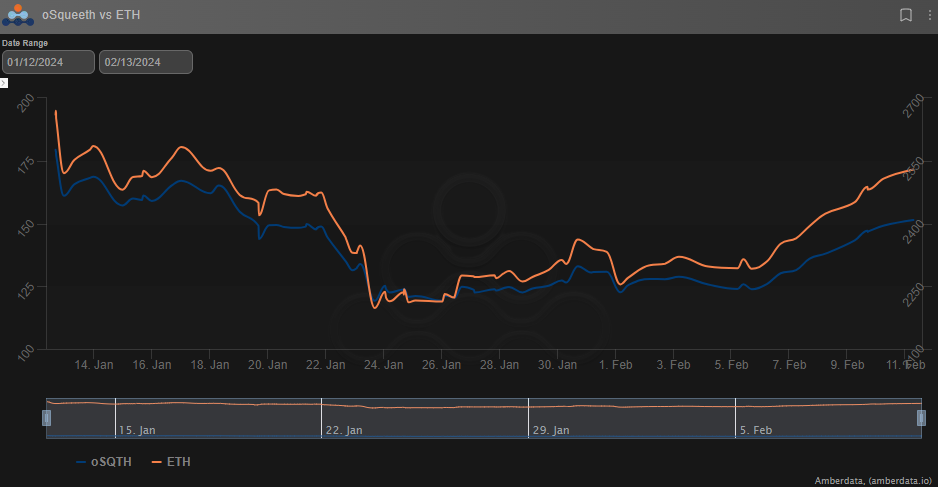
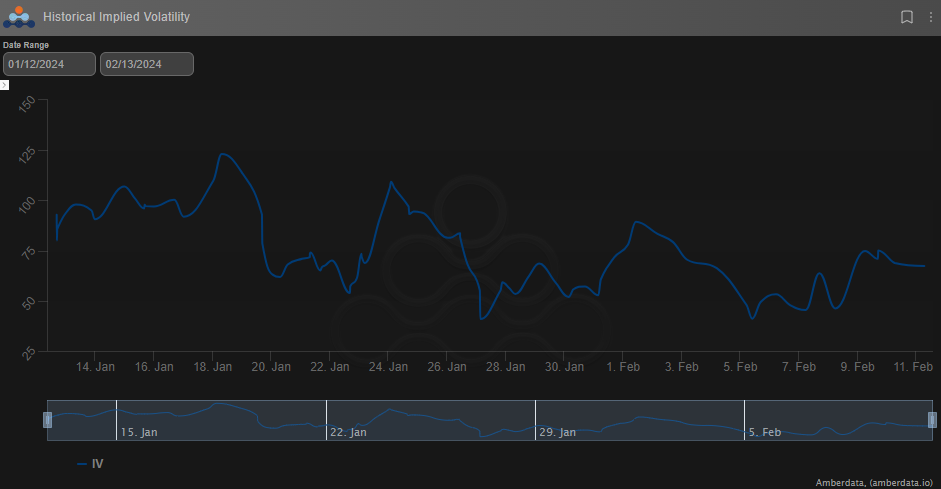
Volatility
oSQTH IV remained active this week, trading down to the 40s before settling back in the 60s.
Volume
The 7-day total volume for oSQTH via Uniswap oSQTH/ETH pool was $133.86k
February 4th saw the most volume, with a daily total of $43.79k traded.
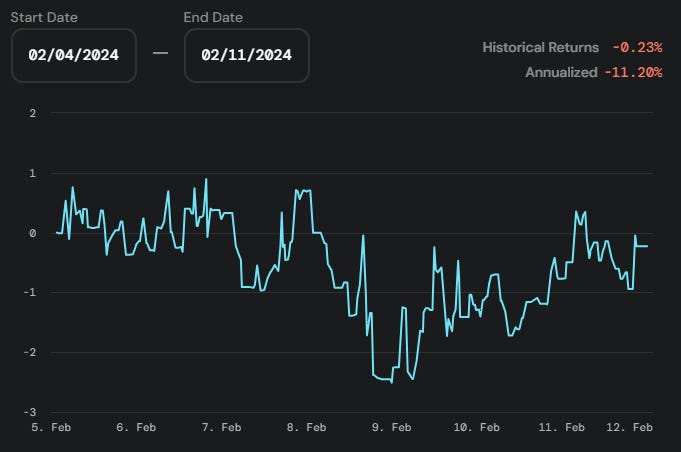
Crab Strategy
Crab saw gains ending the week -0.23% in USDC terms.
Twitter: https://twitter.com/opyn
Discord: discord.gg/opyn
AMBERDATA DISCLAIMER: The information provided in this research is for educational purposes only and is not investment or financial advice. Please do your own research before making any investment decisions. None of the information in this report constitutes, or should be relied on as a suggestion, offer, or other solicitation to engage in, or refrain from engaging, in any purchase, sale, or any other investment-related activity. Cryptocurrency investments are volatile and high risk in nature. Don't invest more than what you can afford to lose.
