Share this blog:
Navigating the volatile BTC and ETH markets demands sophisticated tools and insights, regardless of the institutional investor’s scale. Amberdata’s Market Intelligence solution Amberlens, addresses this need by providing institutional asset managers, researchers, analysts, and professional traders with critical data to make informed decisions.
This blog focuses on using AmberLens BTC and ETH key indicators to identify market tops and bottoms, empowering users to discern trends, evaluate market sentiment, and refine their investment strategies. By harnessing the analytical capabilities of AmberLens indicators, institutional traders can gain a significant competitive advantage.
Market Sentiment
Understanding market sentiment is crucial for institutional investors as it offers insights into the collective psychology of market participants and potential shifts in price direction. AmberLens provides several key metrics for gauging Bitcoin and Ethereum sentiment, each with its own unique strengths and applications:
Price and Moving Averages
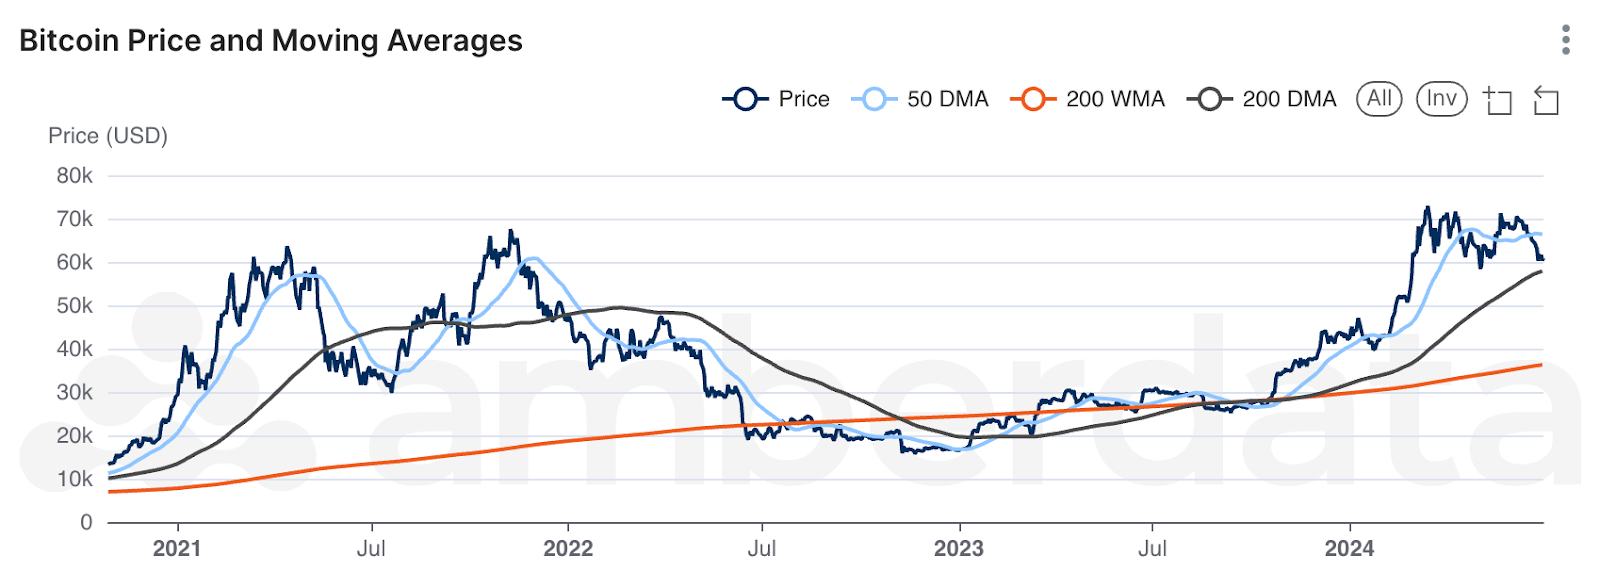
The starting point for assets is most often price. Using daily and weekly moving averages, we can track the price of BTC or ETH along with support, resistance, and trendlines. Using the 50-day moving average (50 DMA) and the 200-day moving average (200 DMA), you can see patterns such as death crosses, which signal price weakness and historically precede price rebounds. In an uptrend, moving averages can act as "support" lines indicating the bottom of a market cycle, while in a downtrend moving averages can act as a ceiling line, indicating the top of a market cycle.
Market Cap vs Realized Cap
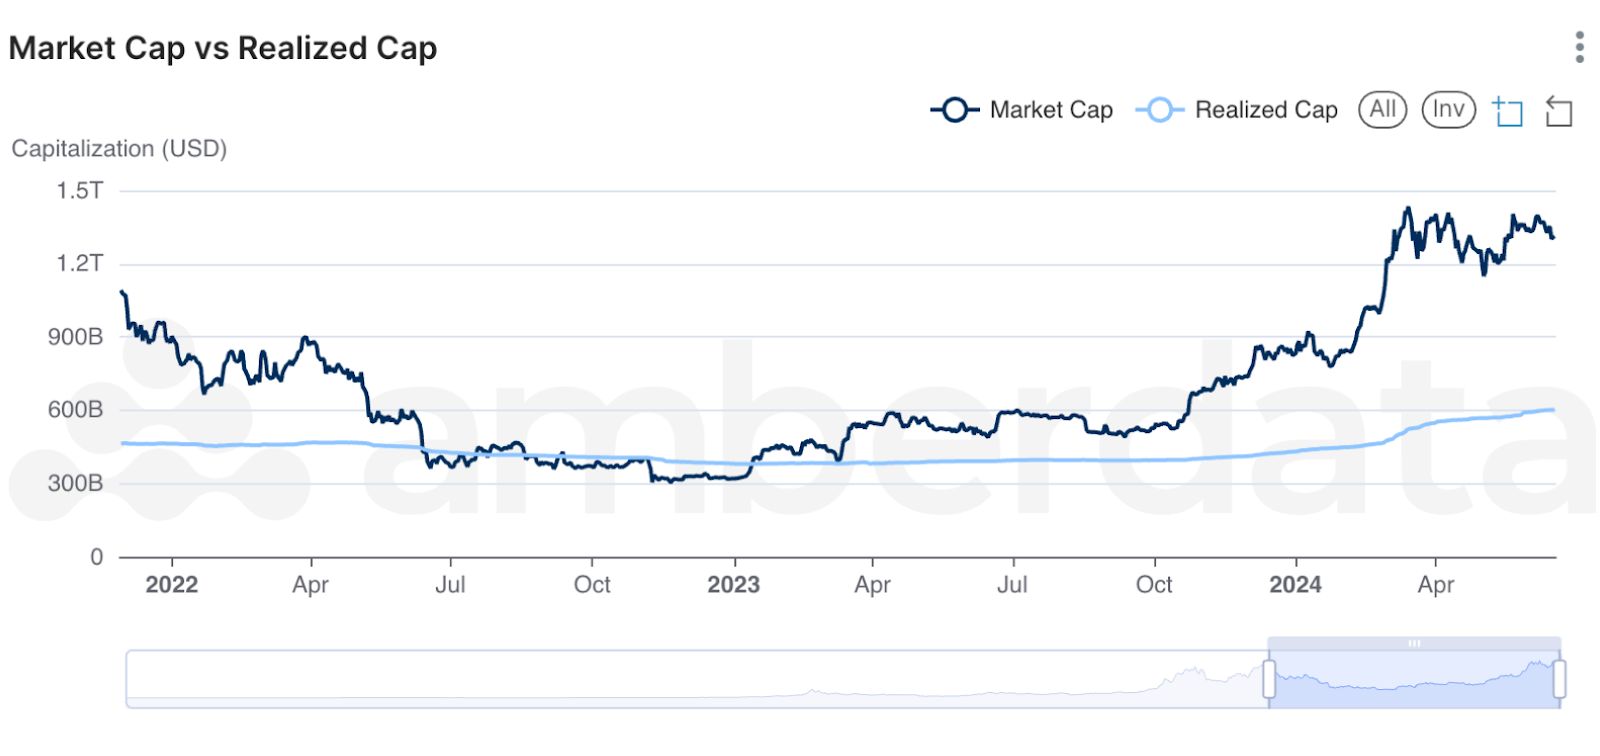
AmberLens covers both ETH and BTC Market Cap vs Realized Cap. Realized cap offers a complementary view to Market Cap: The Realized Cap is the price of all assets at the last time they moved while the Market Cap is the price of all assets at the current price. Realized Cap can also represent the value of all coins in the network, and can serve as an aggregate cost basis for the network.
Given the methodology to calculate this metric, older assets have a significant weight on the Realized Cap given their age and the lower price at which they last moved. When older tokens move, the lower price of those tokens is then re-valued at the new price and can create a large shift in Realized Cap. When Realized Cap > Market Cap, the network is out of profit and is in an aggregate loss. When Realized Cap < Market Cap, the network is in profit and is in an aggregate profit.
The above chart compares Bitcoin’s Market Cap and Realized Cap from 2022 to mid-2024. Market Cap, which fluctuates based on current prices and supply, shows significant volatility with notable declines in 2022 followed by a strong upward trend starting in late 2023. Realized Cap, representing the aggregated value of all UTXOs at their last moved price, remains more stable, reflecting the underlying value of the holdings and providing a smoother measure of the asset's value over time.
Market Value: Realized Value (MVRV)
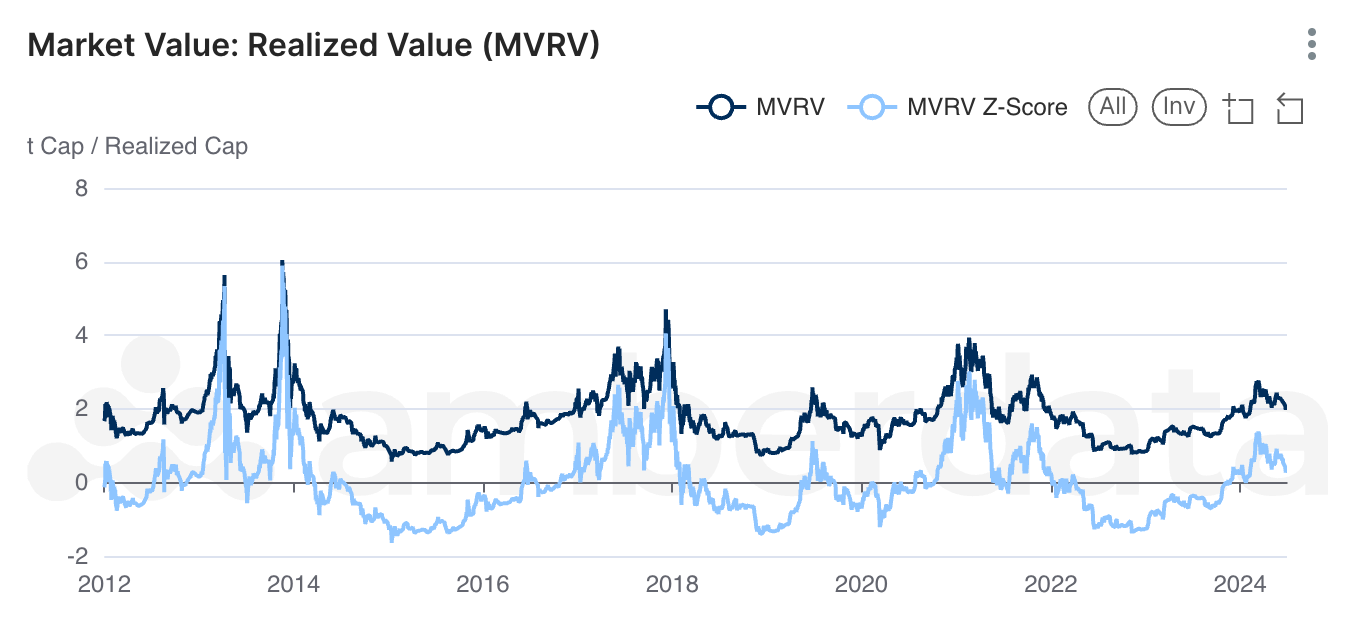
The MVRV Z-Score compares the network’s market value to the realized value. It is used to predict top and bottom prices at the extremes of market conditions and to determine if an asset's realized value is overvalued or undervalued relative to its market value. When the market value is significantly greater than the network value (high z-score), the market is often near a market top.
When the market value is significantly less than the network value (low z-score), the market is often near market lows. AmberLens covers ETH and BTC MVRV. This metric is useful to determine the state of the market and its current phase, compare historical market highs and lows with other assets, and can be used to buy the network low and sell a network high when the network realized value is significantly greater or less than the market value.
Pi Cycle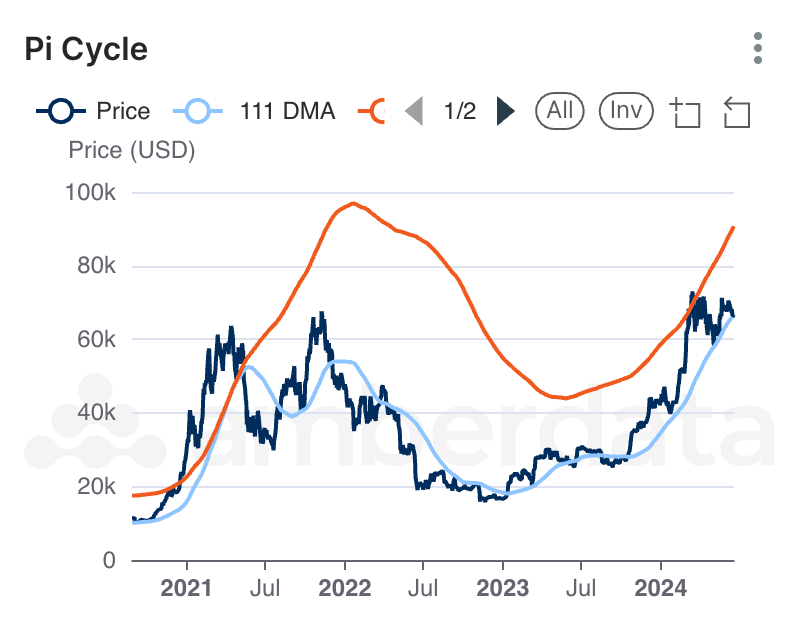
The Pi Cycle top is used as an indicator for market “overheating”, and has been attributed to “predicting” 4 different cycle tops. This indicator is used as a sell signal, when the price peaks before pulling back. When the 111 day moving average (DMA) crosses or touches the 2x 350 DMA, it is an indicator for the top of the price cycle. AmberLens covers ETH and BTC Pi Cycle. This metric can be used by traders to signal the price top of the current cycle, by analysts to understand the current cycle state, and by researchers to correlate this metric with other metrics to identify patterns of adoption.
These market sentiment indicators provide institutional investors with valuable tools for making informed decisions about BTC and ETH. By analyzing and familiarizing yourself with these indicators, traders can develop strategies to navigate the complexities of the ETH and BTC markets and potentially identify profitable opportunities.
The Pi Cycle chart above shows the price of BTC along with its 111-day moving average (111 DMA) from 2021 to mid-2024. In late 2021, the price peaked above $60k, followed by a decline throughout 2022 where it dropped below $20k by mid-year. The 111 DMA, represented by the red line, saw a significant drop through 2022, then began a steady increase from mid-2023, with the price following a similar upward trend and nearing $60k again by mid-2024.
Bitcoin Yardstick
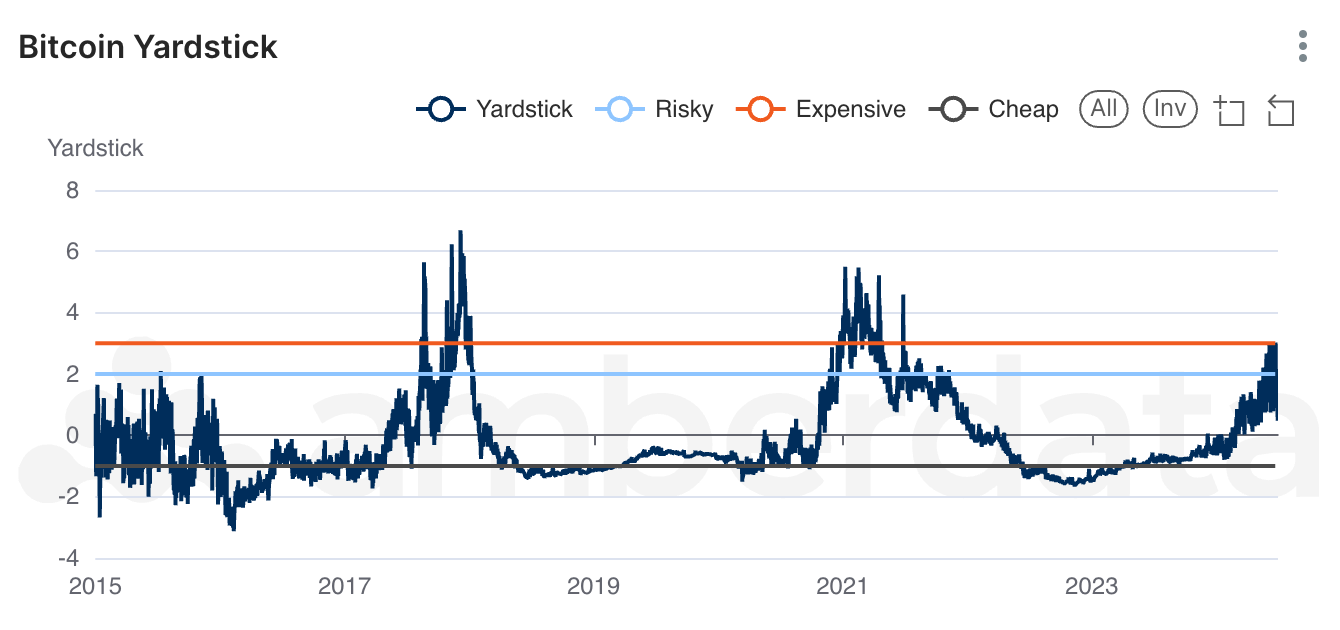
The Bitcoin Yardstick is a metric that attempts to create a “P/E ratio for Bitcoin” (P/E ratio assesses the value of a company's profits to its earnings to analyze its stock). For Bitcoin, this translates to the perceived value of the network compared to the energy used to maintain it. The Yardstick identifies three notable conditions: "Cheap" (Yardstick < -1σ under the mean), "Risky" (Yardstick > +2σ above the Mean), and "Expensive" (Yardstick > 3σ above the mean). The Bitcoin Yardstick can help spot price disparity for long-term investment strategies and correlate the price changes with historical events (i.e., expensive Bitcoin during bull markets, Bitcoin becomes cheap during bear markets, Bitcoin became cheapest when FTX filed bankruptcy).
Reserve Risk
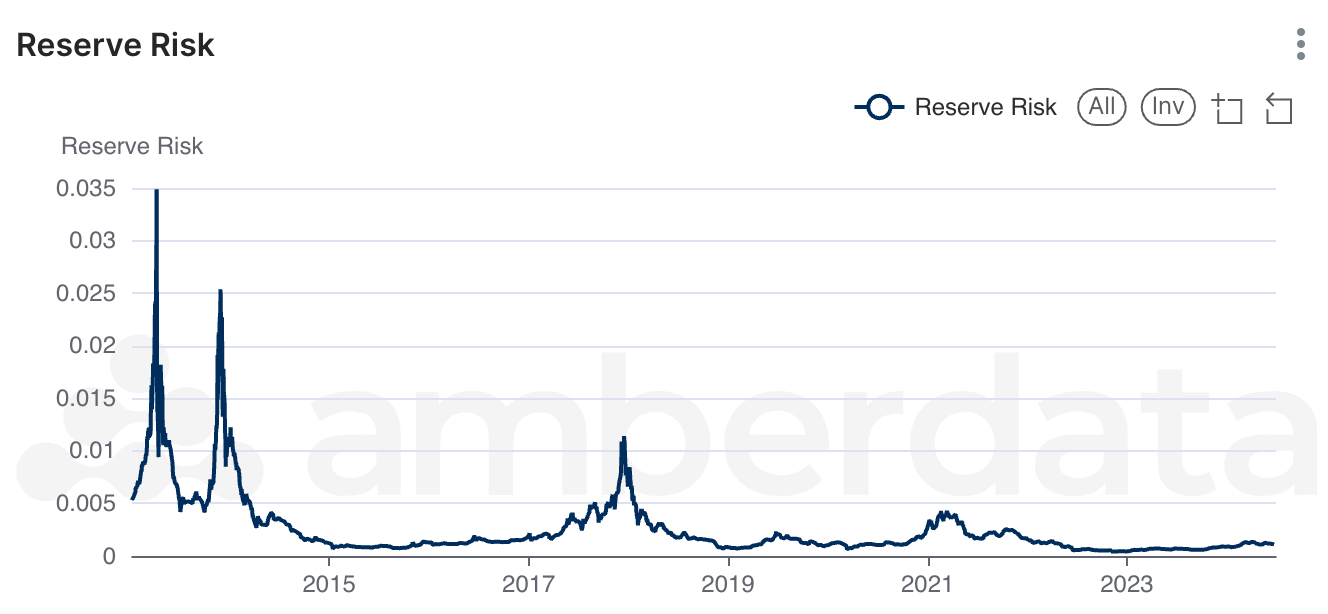
Reserve Risk is a metric that gauges the confidence of Bitcoin holders relative to price. It can be interpreted as a confidence score of long-term holders. When confidence is high, and the price is low, reserve risk (low) can indicate that it is an excellent time to buy. When reserve risk is low, it generates oversized returns. However, when confidence is low, and the price is high (reserve risk is high), the indicator is a sell signal – there is too much risk. Reserve risk can help traders understand when it is an excellent time to buy, and researchers analyze the confidence of long-term holders.
Final Thoughts
AmberLens provides institutional investors with a suite of sophisticated tools and indicators that help them understand market sentiment and identify potential market tops and bottoms for BTC and ETH. By leveraging metrics such as Price and Moving Averages, Market Cap vs. Realized Cap, MVRV Z-Score, Pi Cycle, Bitcoin Yardstick, and Reserve Risk, investors can gain a nuanced understanding of market dynamics.
Each of these indicators offers unique insights that, when combined, provide a comprehensive view of the market. Understanding these metrics allows investors to make more informed decisions, manage risk effectively, and potentially capitalize on market opportunities. The integration of these tools into investment strategies can offer an edge in the crypto economy, enabling investors to navigate market fluctuations with greater confidence.
AmberLens Market Intelligence is available for anyone to use for free. For institutional investors interested in the underlying historical metric data behind AmberLens charts (available in AWS S3, Databricks Google Analytics Hub, and Snowflake), ask for a demo.
To explore the BTC indicators further and understand how to incorporate them into your trading strategies, download the Introducing Bitcoin Market Indicators report. This resource provides an in-depth look at these metrics, complete with historical data and analysis, helping you stay ahead in the dynamic world of BTC trading.
