Share this blog:
In 2023, we witnessed significant growth in Total Value Locked (TVL) and transaction volume across various blockchain networks, signaling mainstream acceptance. The emergence of Real-World Assets (RWAs) within crypto, particularly illiquid collectibles, highlights a new era of seamless asset interaction. Looking forward to 2024, expect continued innovation in areas like NFT lending markets, SocialFi, and the convergence of AI and Blockchain.
Derivatives
While we don’t discuss derivatives in this report, we ask readers to refer to our comprehensive derivatives report for more. Reach out to hello@amberdata.io to obtain our latest derivatives report: “Bitcoin's Next Frontier: Institutional Demand in the World of Options and Futures Trading”
Analyst Commentary and Key Takeaways
Reflecting on 2023, we witnessed expansion in both Total Value Locked (TVL) and transaction volume across numerous L2s and Alternative L1 networks. This trend underscores the maturation and increasing mainstream acceptance of these innovative blockchain solutions. Anticipate that we will see continued growth across other networks with SOL leading the way:
-
The particularly intriguing development was the emergence of Real-World Assets (RWAs) within the crypto space. The initial wave primarily consisted of illiquid collectibles, which have found a new lease on life in the permissionless environment of the blockchain (wines, whiskeys, watches). This shift has significantly reduced friction, facilitating the seamless interaction of these assets within the digital realm.
-
In the realm of NFTs, while the market endured its share of challenges in the past year, it also witnessed innovative projects sprouting within the NFT Financial markets. As we move forward, 2024 promises to be a pivotal year for NFT lending markets, showcasing the evolution of financial products in the NFT space. Expect to see major innovation in the space this year, particularly in either Soulbound tokens, privacy-based chains, or L2s. Completion or maturity of these projects are bullish signs of a sustained crypto market
- SocialFi also began to gain ground, with platforms like
Friends.tech demonstrating waves of growth. These platforms are redefining how social interactions and finance converge within the crypto space.
-
Coinbase continued to drive innovation and foster adoption within the ecosystem. Their commitment to BASE has made it a cornerstone for the evolving concept of SocialFi, establishing it as a home for the ever-growing community of crypto enthusiasts.
2024 will be a big year for digital assets with several ground-breaking events poised to occur this year across a variety of dimensions, it will likely be marked as one of crypto’s many turning points, marking the end of the two-year-long bear market. The coming quarter will be decisive in determining whether this is the start of a new crypto summer or a false spring. Here’s a quick look at what to expect:
-
Bitcoin, Ethereum, and other asset spot ETFs will be the main focus early in the year. After the spot BTC ETF was approved, we saw near-record numbers traded for the ETF launch and hopes are that this momentum will continue throughout the year.
-
Following this, eyes will start to turn towards Bitcoin halving expected in April. The last halving occurred in 2020, with each previous halving leading to a major price increase in BTC over the period. With just two more (expected in 2028 and 2032), this marks the second half of Bitcoin’s halving schedule and 96.875% of the supply mined.
-
Stablecoins will be another key frontier for many institutions, banks, government agencies, and regulators. Expect payments and CBDCs to be a large part of the conversation this year and keep an eye on potentially a large number of non-USD stablecoins set to launch.
-
Regulation is likely to move in very big ways around the world. The United States is likely to move forward with new regulations on the industry in some form and we'll see a lot of clarity when it comes to some of the SEC's ongoing enforcement actions. I wouldn't be surprised if we see some signs that the banking sector is starting to embrace the digital assets industry more than in the past. In addition, the 2024 elections will likely be a major talking point for regulators and politicians. We've seen hard stances on both sides of US politics, and I expect it to be a wedge issue throughout the year. For the rest of the world: VARA, ADGM, HKMA, ESMA / MiCA are already ahead of the curve.
-
Real World Assets will be the booming segment to watch; we've seen the foundations being set up this year but we haven't seen the mainstream catch up just yet. We expect a few RWA protocols to make several mainstream headlines this year.
-
Scams and exploits will be another important area for security experts, companies, and protocols. We're seeing exploits move from simple copy/pastes of previous schemes to far more sophisticated ones like the recent KyberSwap and Euler Finance exploits and the Curve Finance exploit caused by third-party vulnerabilities.
-
A convergence of cutting-edge technologies is also underway, as Artificial Intelligence (AI) and Blockchain come together in new ecosystems such as Bittensor, Ocean Protocol, Render Network, and Fetch.Ai. This integration underscores the growing need for open-source and transparent models in the development of AI infrastructure and blockchain solutions, creating a fertile ground for cross-pollination and innovation.
-
Finally, the launch of new chains will bring highs and lows, with technological advancements continuing to bring benefits for scale, but not everyone will survive. I suspect at least one Layer 1 network to collapse, and more will move closer toward Ethereum. Keep an eye on alternative L1s like Solana, L2s like Base and Polygon, and emerging L1s like Berachain, in addition to L1 infrastructure protocols like Eigenlayer.
-
Prediction markets are another facet of the crypto landscape that is poised for robust growth. It has been several years since Augur introduced the first prediction market on the Ethereum mainnet. In the coming years, prediction markets will likely become an invaluable decentralized source of market sentiment, providing a more reliable alternative to relying solely on mainstream media sentiment.
-
The crypto landscape in 2024 is shaping up to be a thrilling chapter in the journey of decentralized finance, with Alt L1s, L2s, RWAs, NFTs, prediction markets, SocialFi, and the convergence of AI and Blockchain leading the way.
Recap - Q4 2023 at a Glance
Token Prices
2023 was no stranger to change! During Q4 2023 alone we saw an ending to the FTX / Sam Bankman-Fried trial which found the founder and CEO guilty of all charges in the first case (the second case alleging political campaign financing charges were dropped on the last day of the year). In addition, we may have seen the start of the latest bull run amongst multiple emerging rumors of Bitcoin spot token ETF approvals.
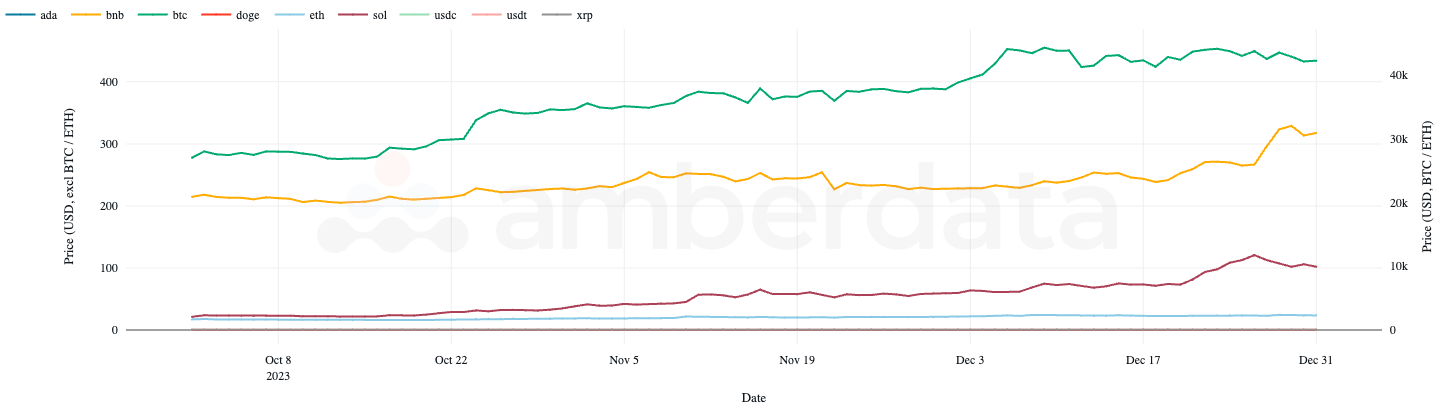
Token prices over Q4 2023, BTC and ETH on the right axis for visual improvement
The last quarter showed signs of a bull run starting with BTC, moving onto ETH, and down through alt-coins. Several tokens experienced breakout moments during the quarter but the most notable might be SOL, which grew more than 400% after many speculated the network to be dead and buried after the FTX collapse due to a perceived tie between SBF and Solana.
High hopes that these price jumps signal a return to form for digital assets and wipe clean the dramatic events of 2021, 2022, and 2023, leaving the bears behind.
Circulating Supply
For some tokens, circulating supply is a great measure of growth. It can signal an increase in demand for the token (as the token is minted, increasing supply) or it can signal underlying asset values (as the token is dependent on the amount of an asset value locked, such as DAI or WBTC). Some tokens, such as BTC, have a fixed supply and are expected to maintain the total supply inflation rate that was predetermined.
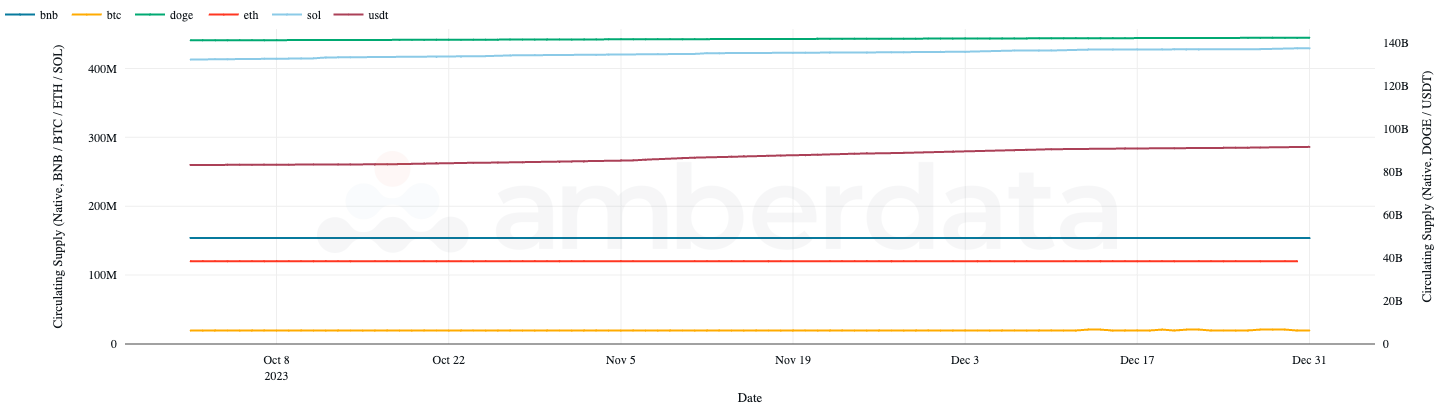
Circulating supply over Q4 2023 with BNB, BTC, ETH, and SOL on the left and DOGE and USDT on the right for visuals
Given some tokens such as BTC have fixed supply, it’s useful to take note of the tokens that do not have a fixed supply/inflation rate such as USDT which grew over 10% last quarter, indicating additional capital inflows into the USDT economy. Circulating supply for USDT increased over the last quarter even with speculation that some malicious actors are swapping USDT for USDC and redeeming for USD. Though this is far from sure and possibly simple FUD (Fear, Uncertainty, and Denial) it’s been broadly considered unfounded speculation. SOL also grew in supply more than other tokens, combined with a huge gain in price during the same period.
Market Capitalization
Market Capitalization (Circulating Supply * Price) often moves in tandem with the market, with growth in prices more often than not the key driver to growth. However, some cases like stablecoins and algorithmic assets which increase or decrease supply through one or more mechanisms are important signs for the digital asset landscape.
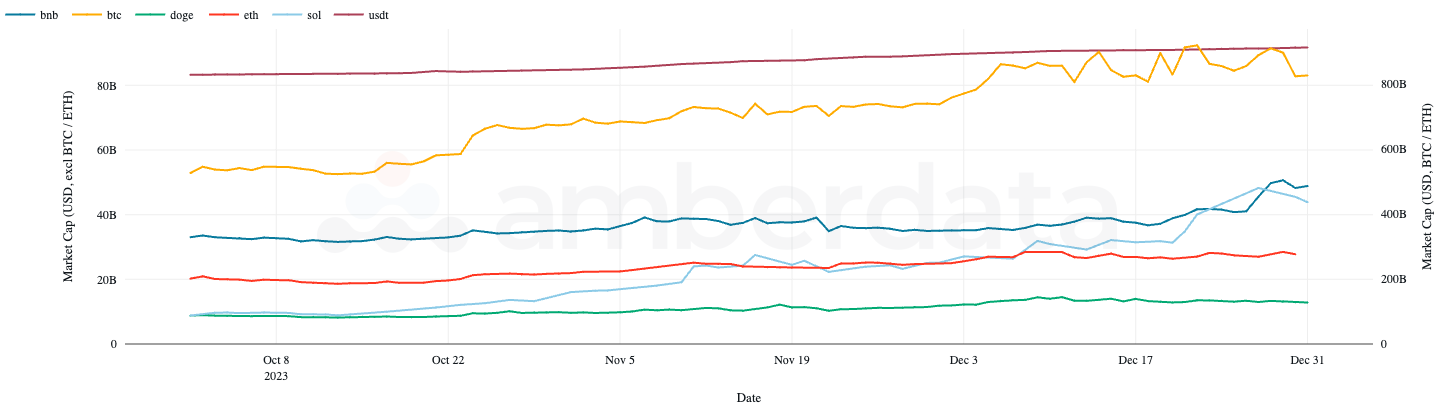
Market capitalization over Q4 2023 with BTC and ETH on the right axis for visual improvement
This last year, we saw market capitalization growth in several alt-coins as price improvements through Q4 2023 drove value upwards. However, levels have yet to reach the 2021 peaks for several tokens including BTC. All eyes were on BTC for the start of 2024 but with the ETFs now approved and actively trading we’ll likely see the public narrative shift.
Bitcoin
Spot Trading
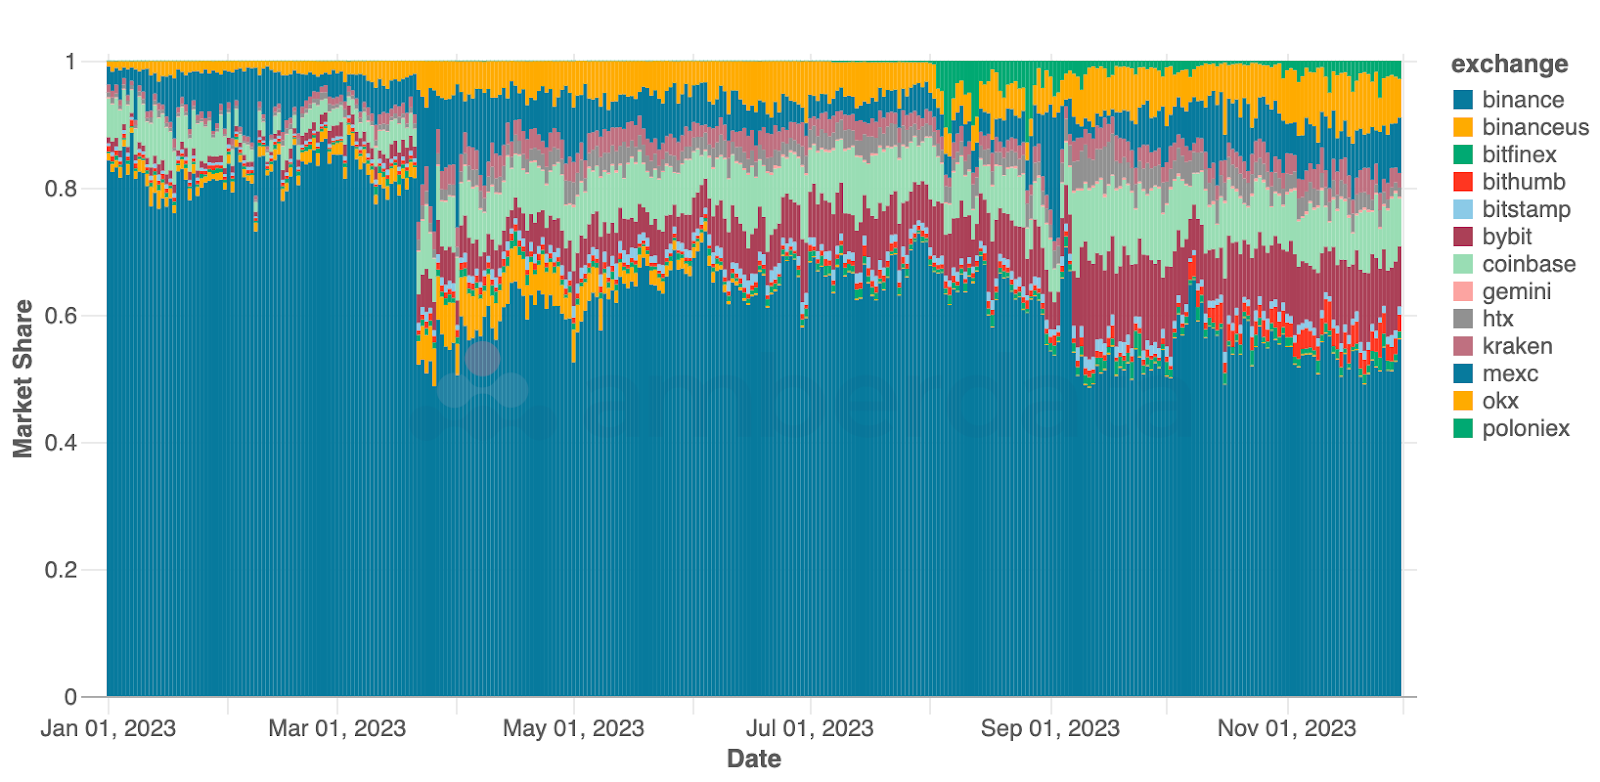
Daily exchange market share for BTC spot trading volume since Jan 2023
In Q2 2023, Binance was hit hard with a massive loss in Bitcoin trading volume amidst charges brought upon the exchange by several US authorities including the Department of Justice (DOJ), the US Commodity Futures Trading Commission (CFTC), and the Securities and Exchange Commission (SEC). During this time, Binance’s trading volume dropped from 80% market share to around 60%, and at the end of summer 2023 Binance US closed several trading books (and moved to a crypto-to-crypto exchange). The major long-term beneficiaries of BInance’s market share collapse were Coinbase and Bybit which have gained several percentage points since March.
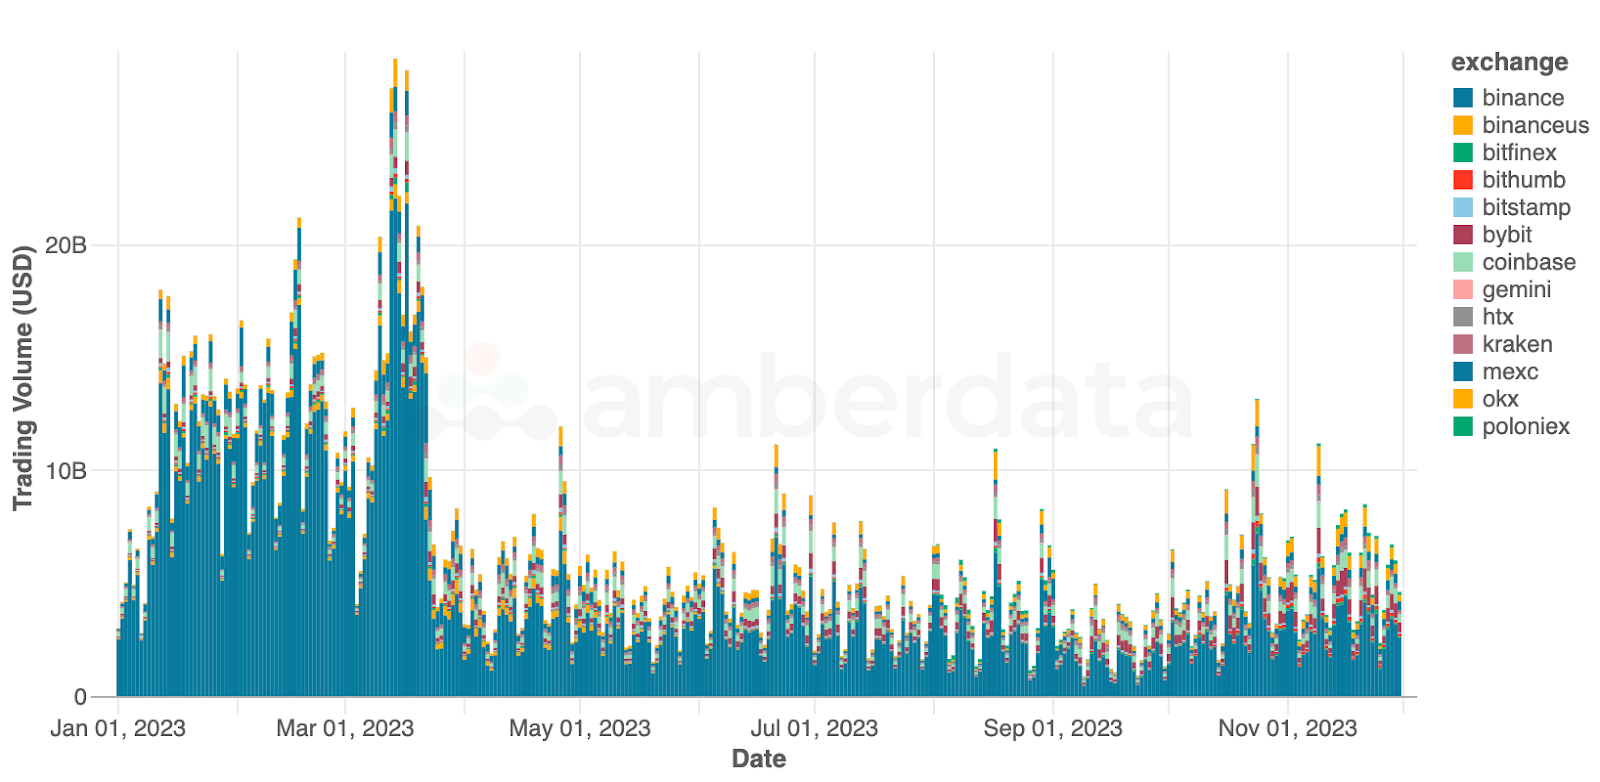
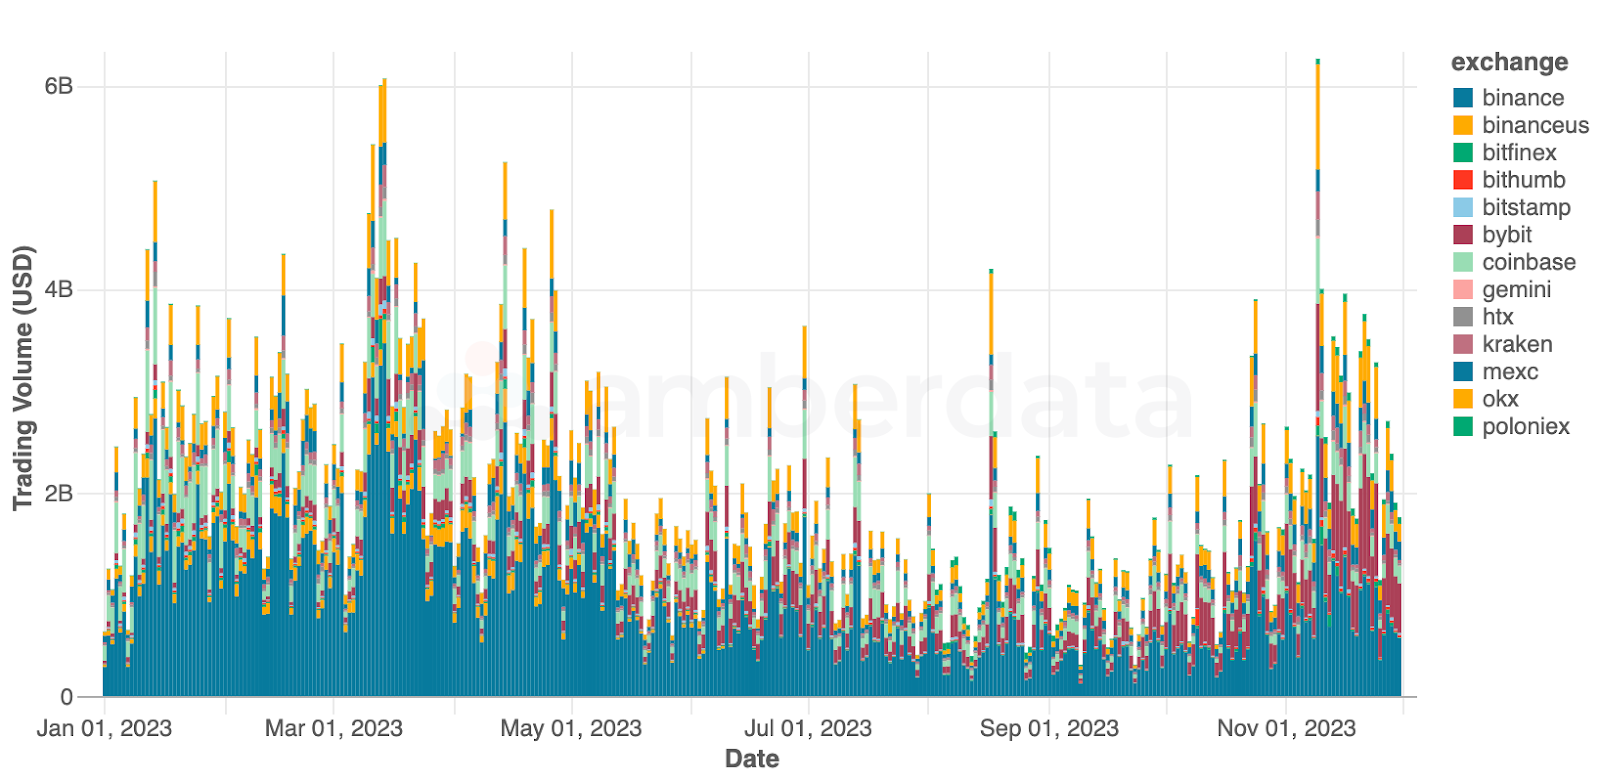
Daily exchange trading volume for BTC spot trading volume since Jan 2023
At the same time, overall trading volume for BTC took a nose dive across every exchange, with total daily trading volume rarely exceeding $10 billion, which was regularly eclipsed pre-March 2023.
Price Indicators
We can also use several price indicators to gauge the current stage of Bitcoin trading, including a comparison of price to the 200 Week Moving Average (MA), a comparison of price to the Pi Cycle Indicator and 111 Daily Moving Average (DMA), and the Bitcoin Yardstick – a measurement of moving average z-scores.
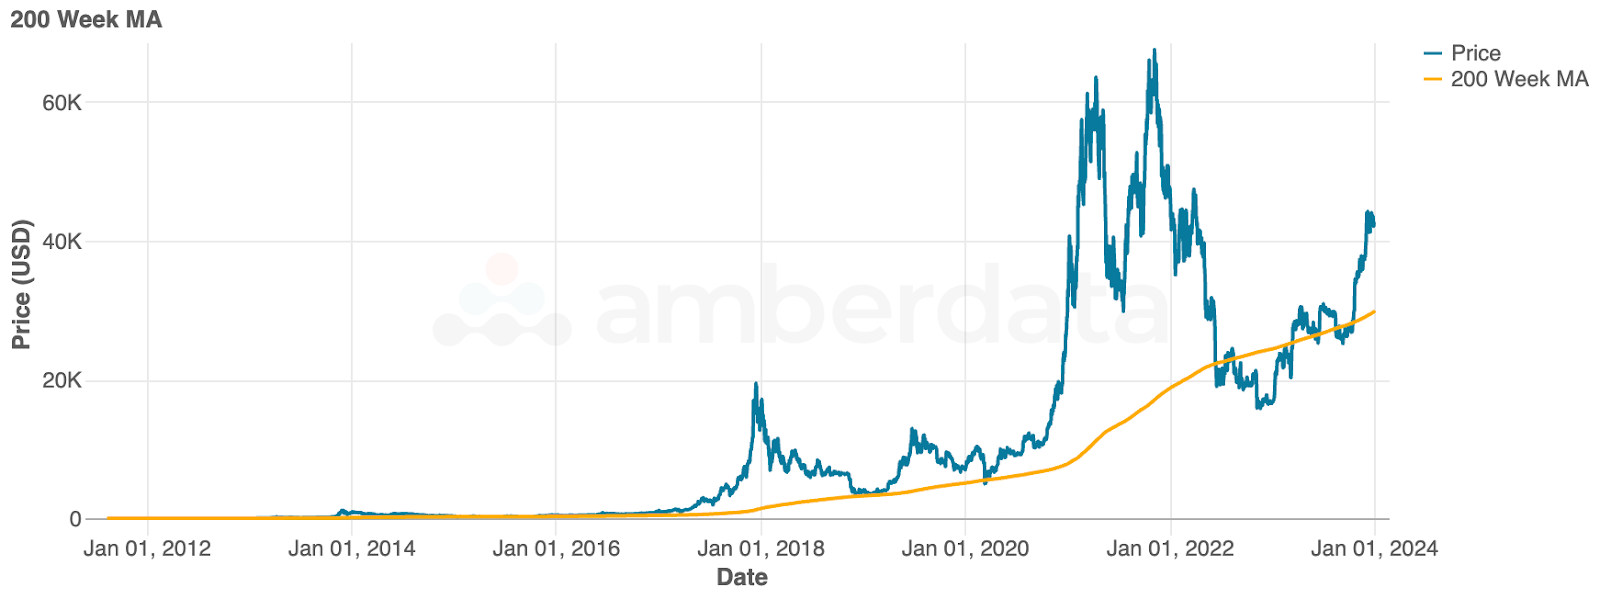
Bitcoin 200-Week Moving Average (MA)
Comparing the price to the 200-week moving average (WMA), we can see that Bitcoin has, as of October 18, 2023, crossed the indicator and is now performing well above. This long-term indicator shows us the significance of the 2022-2023 bear market cycle in that it was the only time (aside from short periods in 2015 and 2020) that the price of Bitcoin traded below the 200-week moving average. This line often represents the bottom price as a support line for technical traders – with Bitcoin’s recent price surge a positive sign that this moving average may represent a support line in the future.
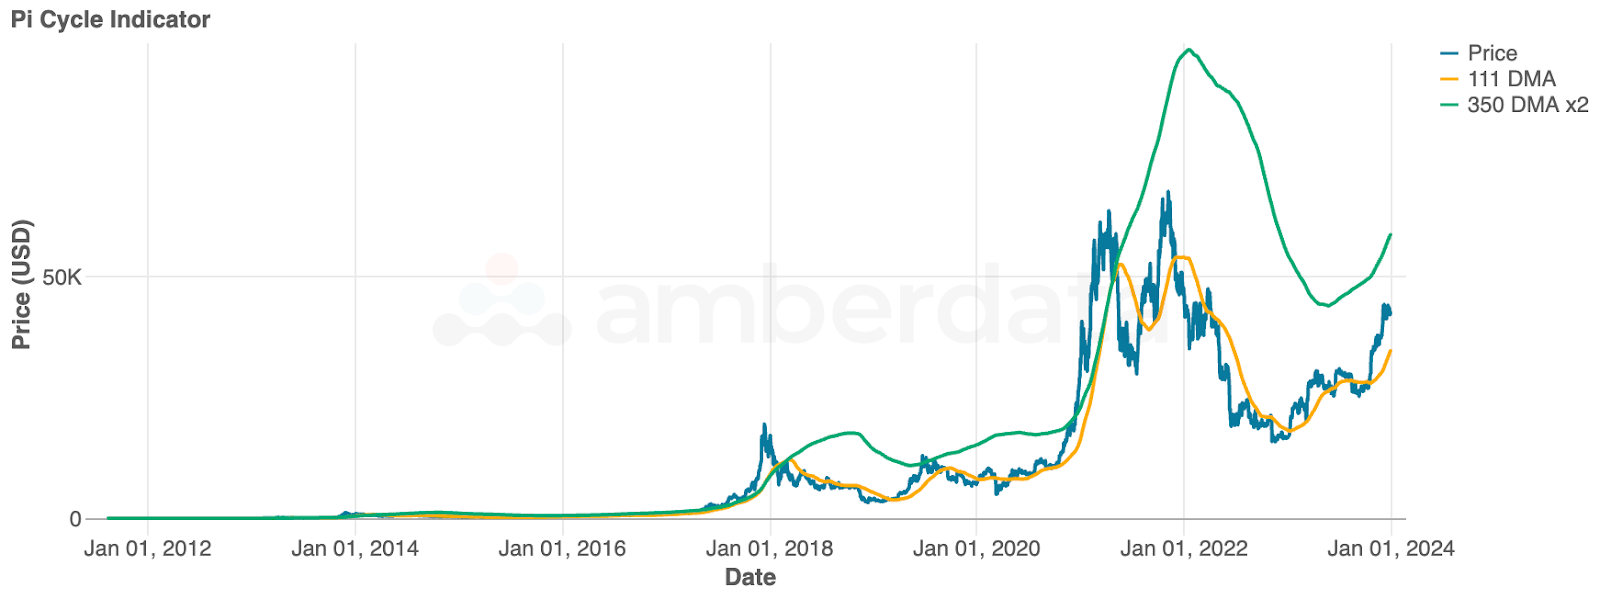
Bitcoin Pi Cycle Indicator
A different perspective to the support line (bottom price) indicator 200 WMA, the Pi Cycle indicators can be used as an indicator of price cycle tops. As the 111 daily moving average (DMA) moves towards the 350 DMA x2 (2x multiple of 350 daily moving average), the indicator suggests a cycle top. Our Pi Cycle shows a lot of room for improvement as the short-term indicator is far from reaching the long-term indicator though the gap has been closing since the end of 2023.
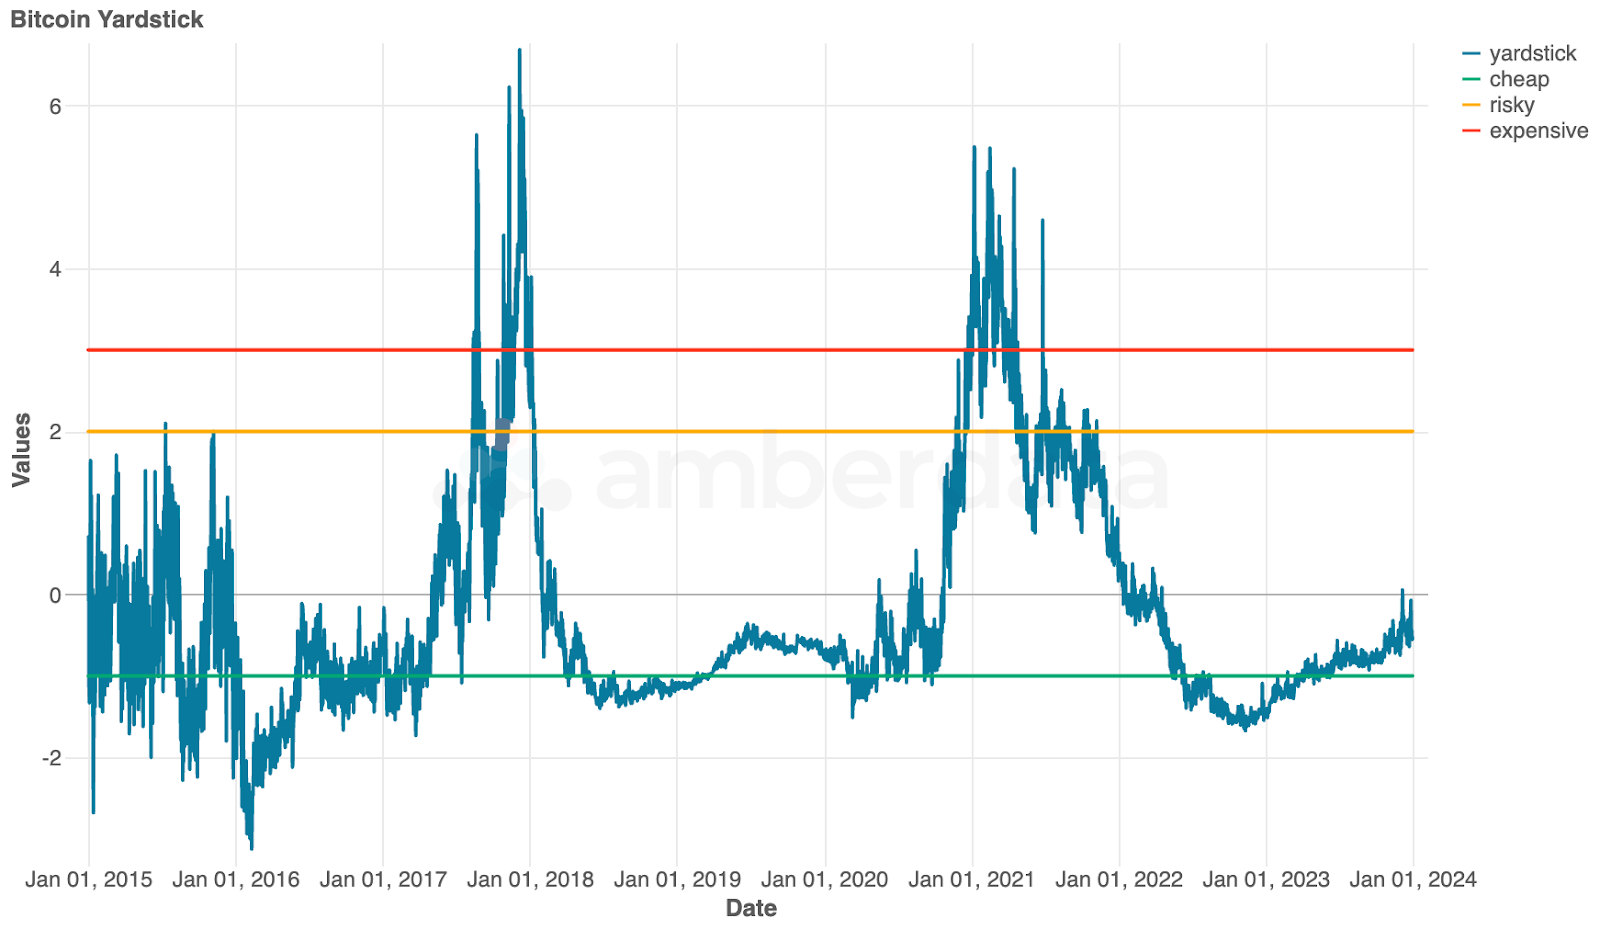
Historical Bitcoin Yardstick
The Bitcoin Yardstick is a similar concept for cryptocurrencies as a Price-to-Earnings (PE) Ratio, with the market cap of the token being divided by its hash rate. The hash rate is used as a proxy for earnings representing the amount of energy expended to secure the network. As the ratio of market cap to hash rate decreases, the value of Bitcoin relative to the energy used to mine it is lower and thus the token is considered “cheaper". As the ratio of market cap to hash rate increases, the value of the token relative to the amount of energy used to produce bitcoin is higher and the token is considered more “expensive”. In 2023, Bitcoin crossed out of its “cheap” stage, though far from risky or expensive.
Network Metrics
Bitcoin has recently emerged out of the toddler years with the introduction of Ordinals and BRC-20s (the Bitcoin equivalent of ERC-20s), transforming the blockchain from a simple store of value ledger system to a new form of programmable currency. While the network is often said to be “competing” with Ethereum, there were few notable methods of comparison between the two which vastly differ in technology and user base. Ordinals and BRC-20s, more specifically inscriptions, started to take off in 2023 as the inscriptions are often compared to NFTs, unlocking a new form of value for sats, developers, and investors.
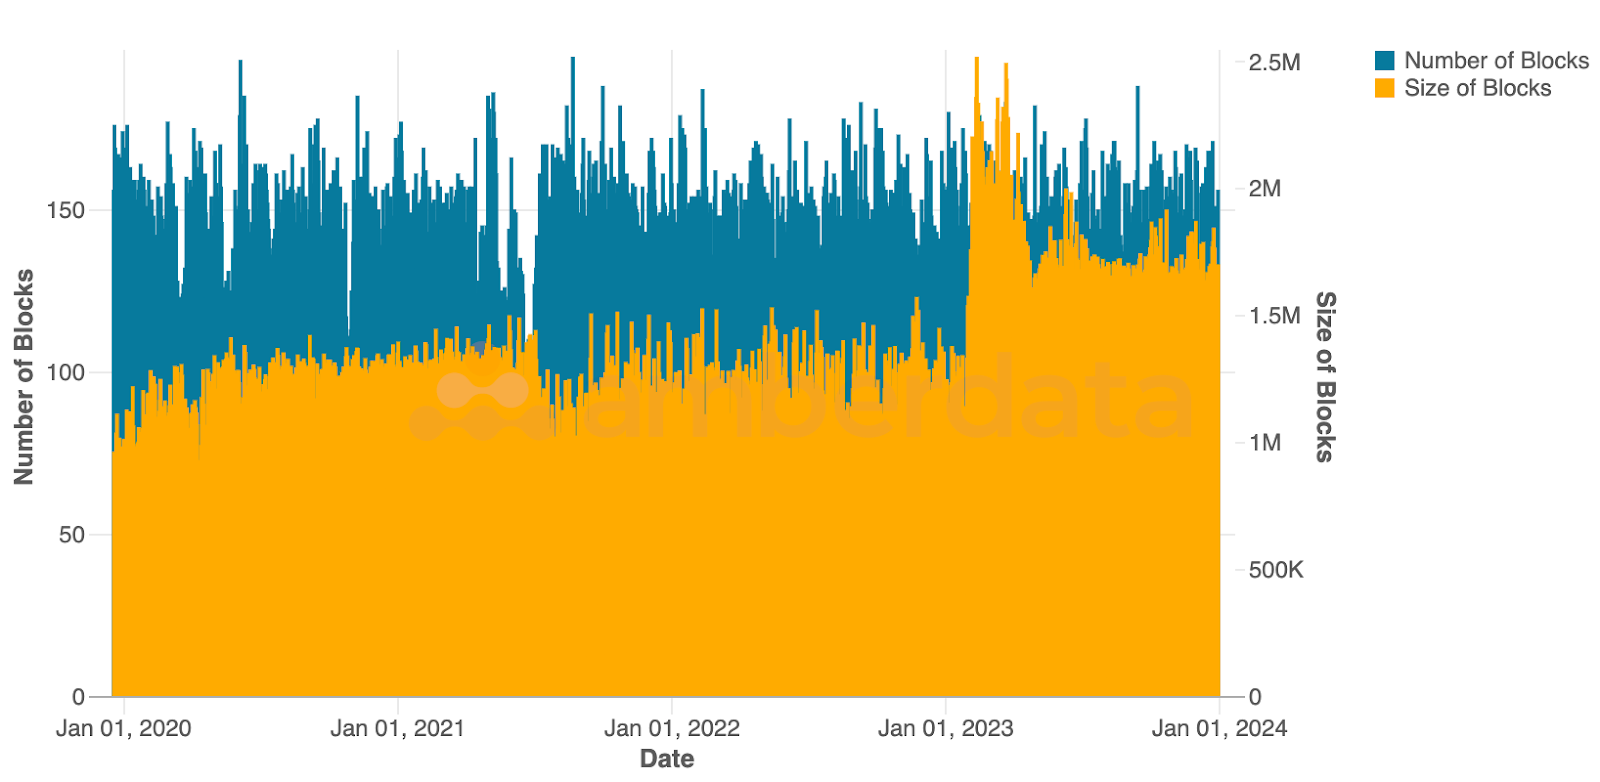
Bitcoin’s daily network block count and size since Jan 2020
One interesting perspective is seeing how Ordinals/BRC-20s affected the network by comparing blocks with block size. Bitcoin has in many ways benefited from a steady output, with stable blocks due to the large number of miners worldwide. Inscriptions are simply data added to satoshis (the smallest form of Bitcoin), with more data being added to transactions increasing the size of the block mined. Inscriptions have been around for some time now, but in February 2023 a huge increase in block size continued through the end of the year.
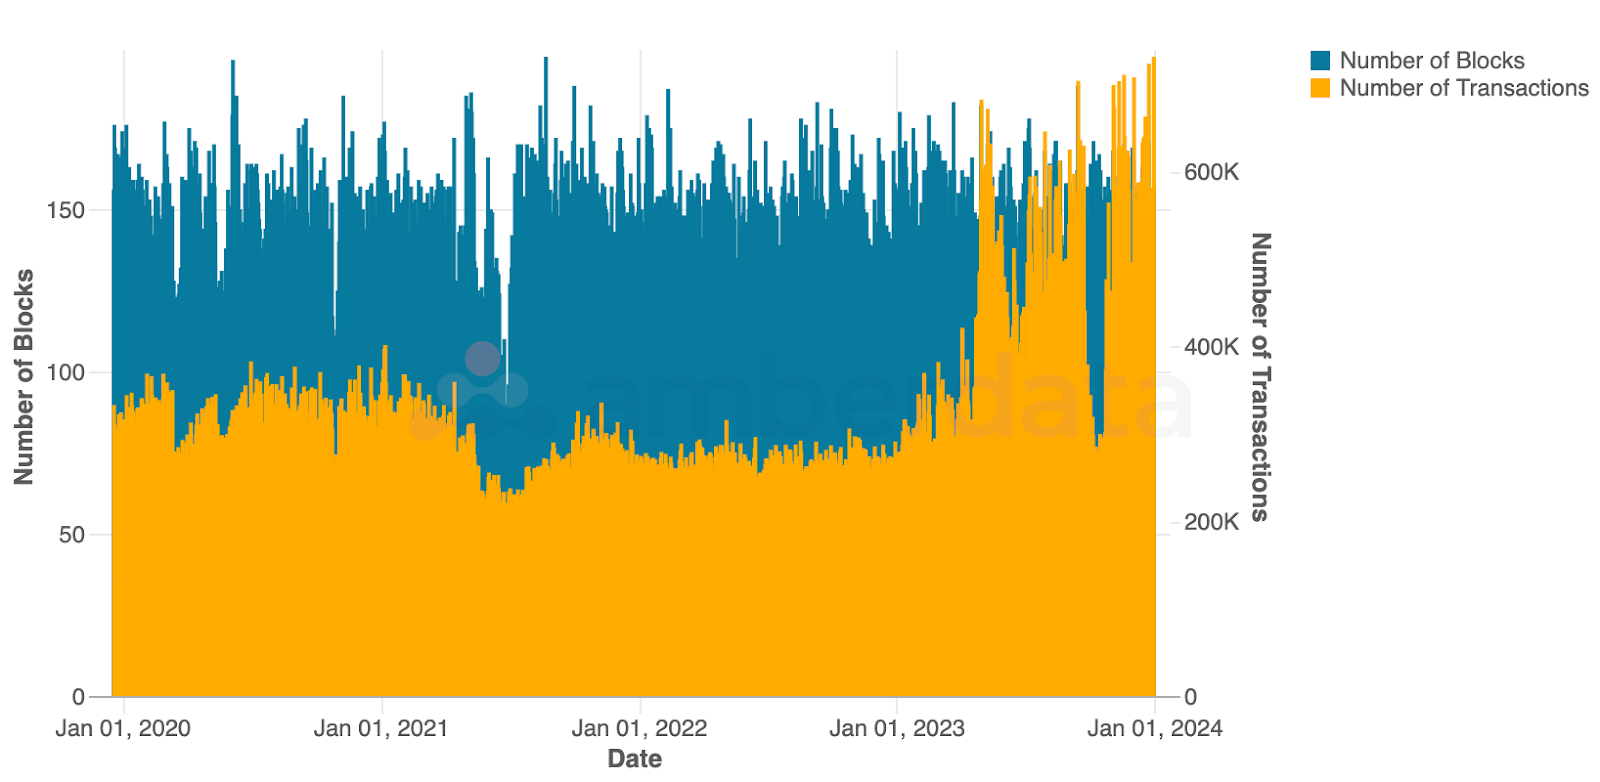
Bitcoin’s daily network block count and number of transactions since Jan 2020
We can also see that the number of transactions on the network began to increase in February, showing strong demand for ordinals/BRC-20s. A drop in transaction volume in early October 2023 brought the network back down to volumes held in 2022 and 2023, but returned in 2024 as the bull market started to charge ahead. It appears that the bull market has held the network to a steady high in transaction volume (without a dramatic increase in block size) – a looming expectation that if the ordinals trend reappears during a bull run, we are likely to see even high network block size and far higher number of transactions.
Ethereum
Spot Trading

Daily exchange market share for ETH spot trading volume since Jan 2023
Similar to BTC, ETH volumes on Binance faced a decline since March 2023 though not nearly as dramatically. The slow decline for Binance has paved the way for Bybit to capture a slow incline of trading volume, filling the gap nearly 1-for-1. Coinbase, on the other hand, has been seeing a decline in market share moving from nearly 20% of the daily trading volume to less than 10%.
Daily exchange trading volume for ETH spot trading volume since Jan 2023
Daily trading volumes for ETH have rebounded far more than BTC in recent months when compared to early 2023 volumes. ETH appears to almost be reaching the same daily trading volume as pre-March 2023 which shows signs of interest for traders in the coming months as the network is a critical component in the on-chain ecosystem being relied on as the main security and infrastructure layer to L2s and side-chains.
Network Metrics
In contrast to Bitcoin, Ethereum’s biggest challenges are network fees and scalability. The network generated user addition through strong developer activity with programmable money verticals like DeFi protocols and support of multiple token types such as ERC-20s and NFTs.
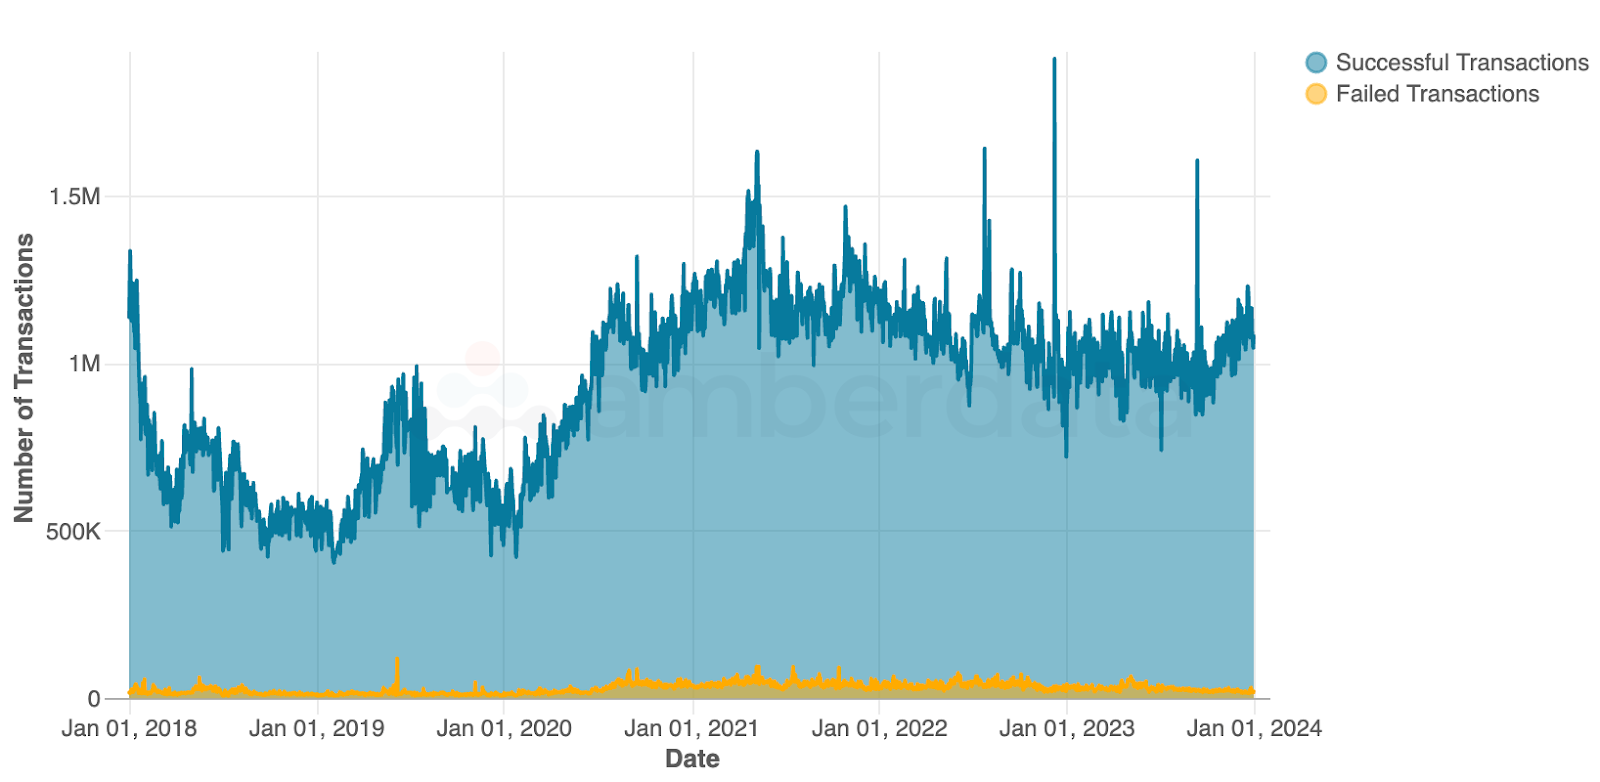
Daily Ethereum transactions (successful vs unsuccessful) since Jan 2018
As the number of users has steadily increased, so too has the number of transactions. And as protocols become more complicated, more use cases emerge, and more features are introduced, the network must charge more for transactions and longer transaction validation times can occur – transactions are often left open longer in hopes of being confirmed in a block, and block space is a valuable resource.
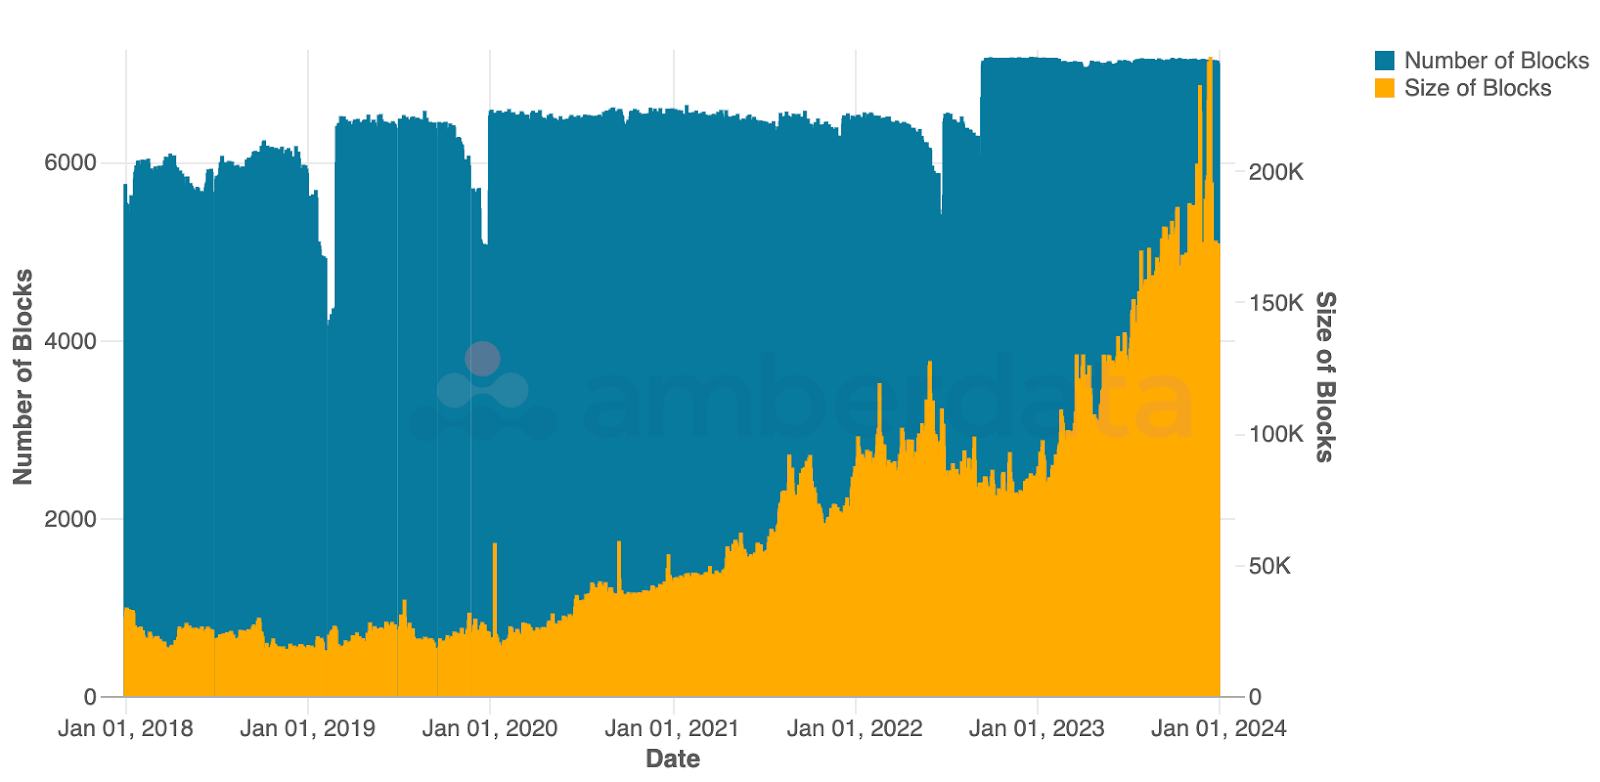
Daily Ethereum number of blocks and size of blocks since Jan 2018
As the network continues to grow in volume, an ongoing battle between network capabilities and network capacity has emerged in the last few years. Ongoing improvements are a challenge for the Ethereum Foundation (the main contributor to the network) with improvements such as the switch to Proof-of-Stake (PoS) from Proof-of-Work (PoW) taking several years to achieve. The new focus for the foundation is on scaling L2s.
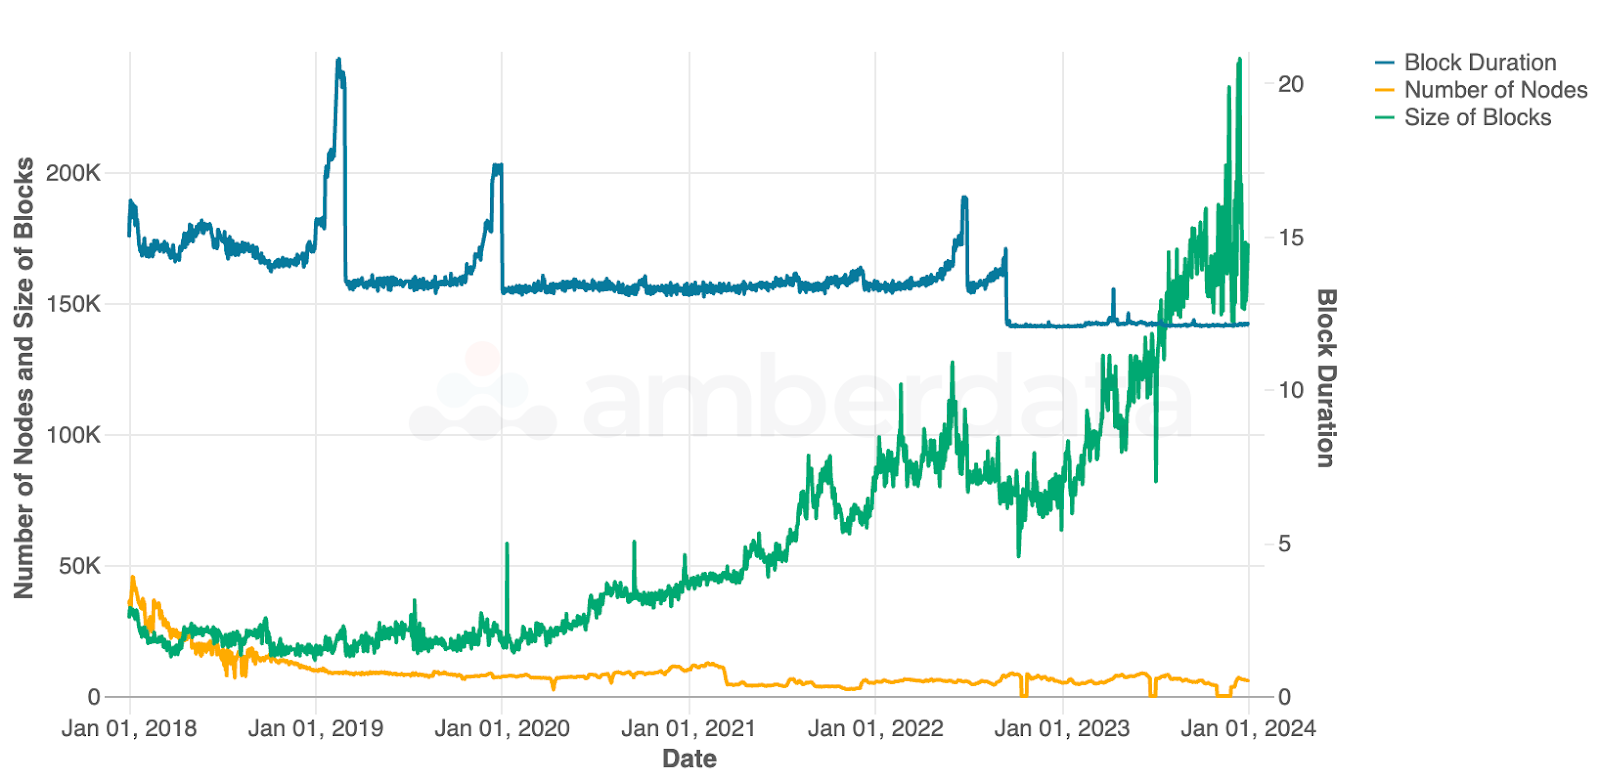
Daily Ethereum block duration, number of nodes, and size of blocks since Jan 2018
It’s too soon to tell if L2’s will be the solution for Ethereum’s scaling issues, but as block size continues to be driven higher, there will be less space for transactions and more room for other networks to step in for the mantle of network supremacy. Lots of eyes on Ethereum’s development cycle point to several key improvements in the pipeline with 2024 set to be a major year for the network – and for others to fill the gap.
Stablecoins
Spot Trading
Stablecoins become a key topic in 2023 with several depeg events, regulatory setbacks and rumors, and launches discussed by institutions and central government agencies (in the form of CBDCs). From fiat-backed stablecoins to algorithmic stablecoins and over-collateralized stablecoins, we will investigate coverage of the four main stablecoins on CEXs: USDC, USDT, DAI, and TUSD.
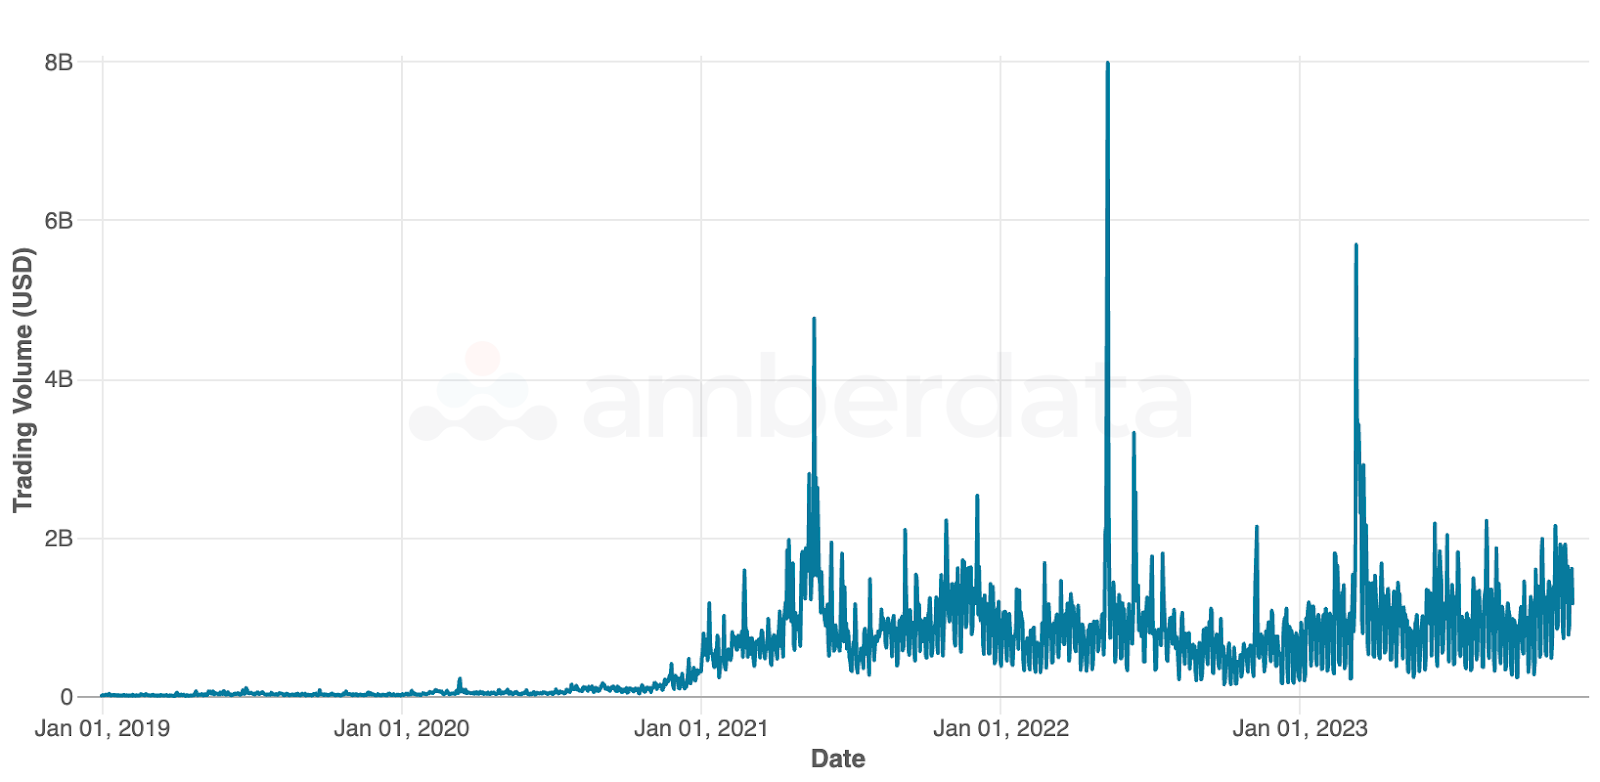
Spot trading volume (USD) for USDC, USDT, DAI, and TUSD since Jan 2019
In general, trading volumes on centralized exchanges (CEXs) continued to grow as stablecoins have become commonplace. Daily trading volumes in 2023 far exceeded historical years as the trend climbs upwards. While CEXs are not the only access point for stablecoins (and each token has its own mint/burn operations), CEXs provide a valuable mechanism for many institutions and retail users to convert fiat to crypto.
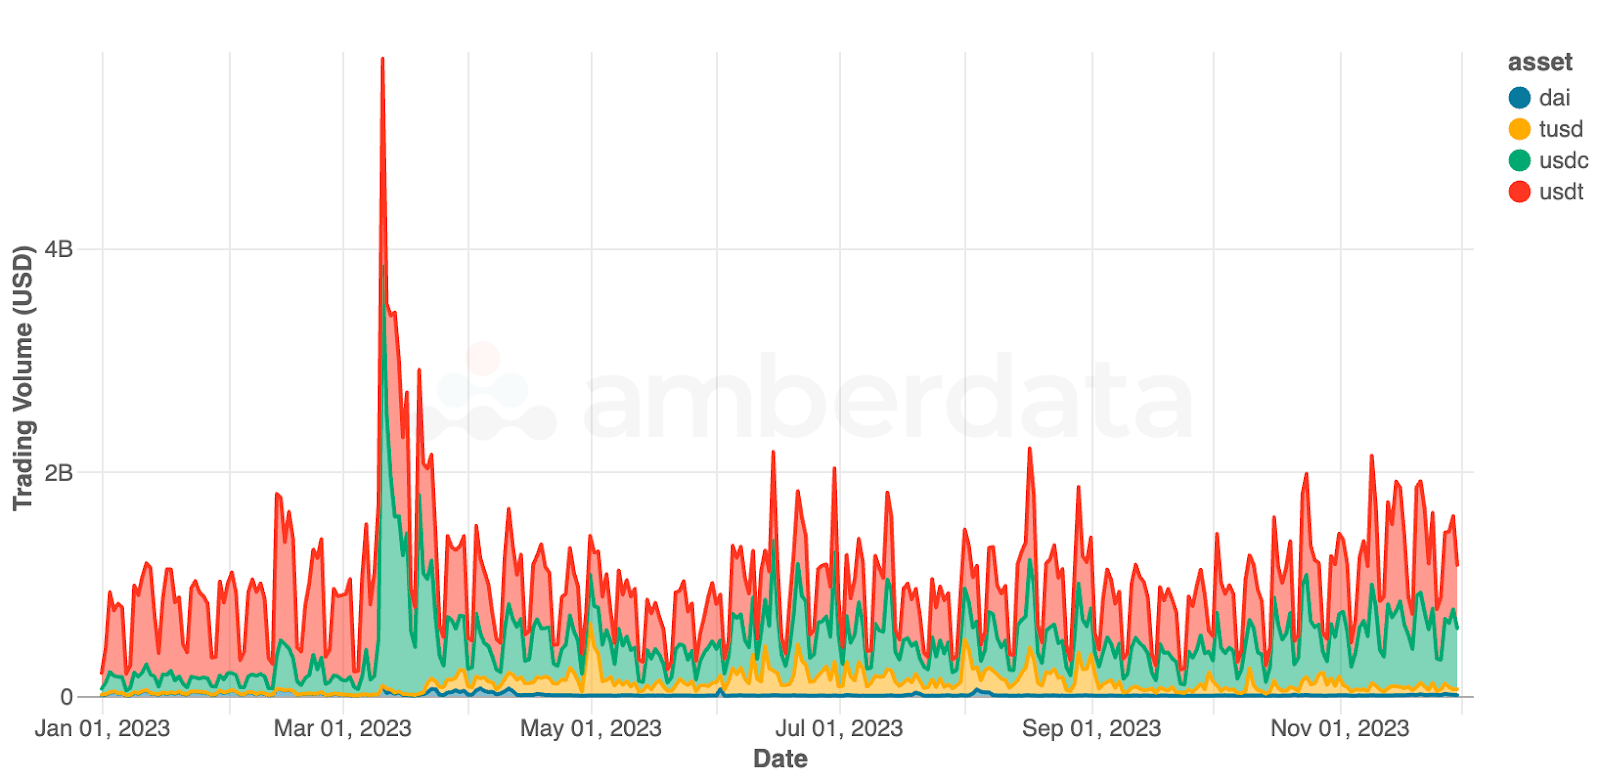
Spot trading volume (USD) for USDC, USDT, DAI, and TUSD since Jan 2023
USDC and USDT are the primary USD stablecoins by trading volume, although TUSD had strong activity starting in late March 2023 as Binance began supporting the asset along with zero-fee discounts to buy and sell BTC. Overall stablecoin volumes regularly exceed $1 billion in daily trading volume, but with several major macro events this year we’ve seen volumes exceed $2 billion quite often. In March 2023, a major depeg for USDC after the collapse of Silicon Valley Bank drove volumes to nearly $6 billion in a day.
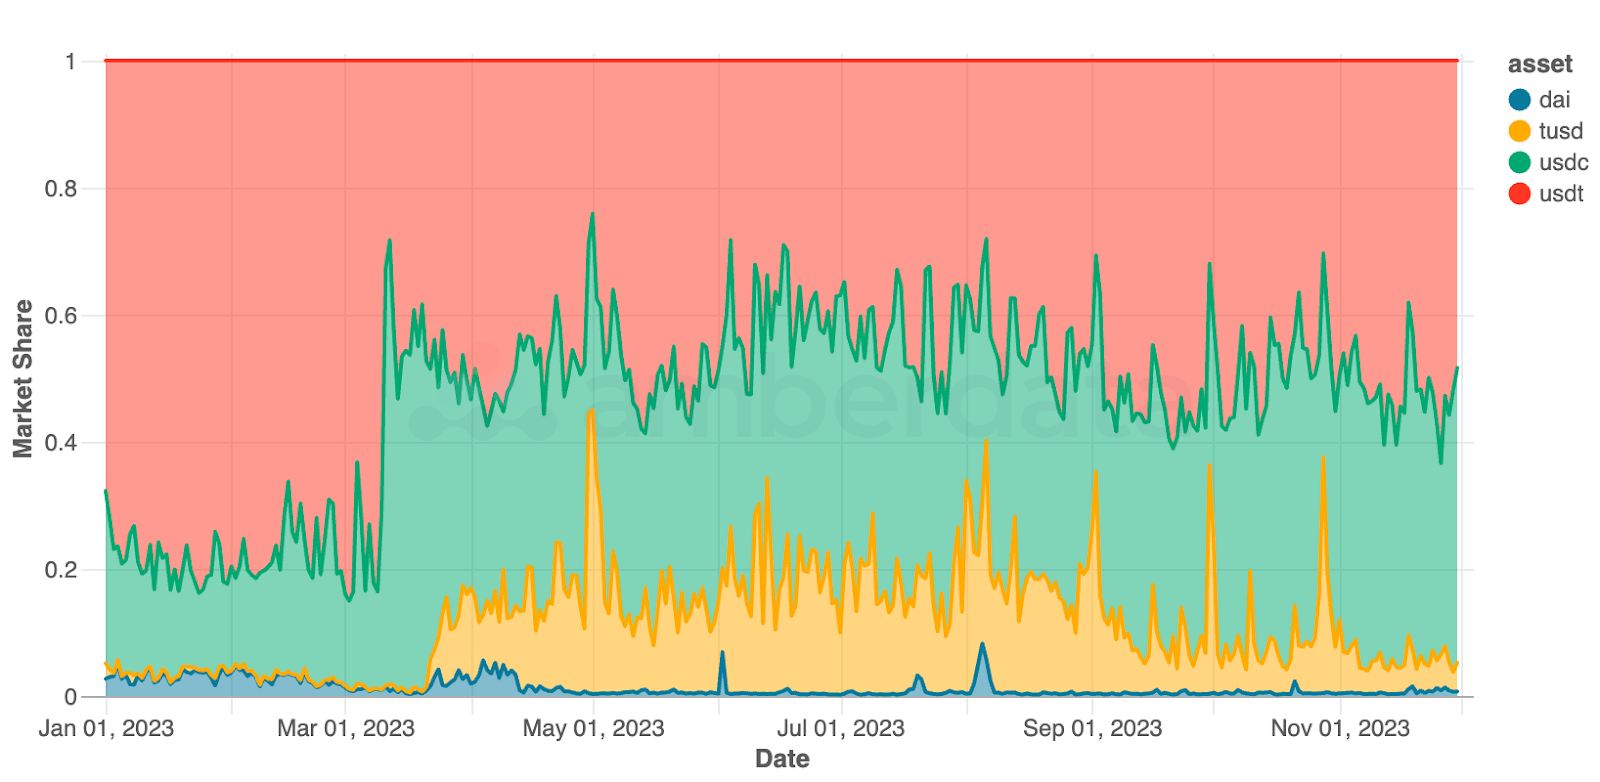
Spot trading volume market share for USDC, USDT, DAI, and TUSD since Jan 2023
Trading volume previously dominated by USDT has shifted this year to weigh much more heavily on USDC and TUSD. Giving credence to not having eggs all in one basket, traders have been diversifying to reduce the risk of depeg events which can dramatically impact any portfolio. Lack of diversification with stablecoins often does not outweigh the benefits in this case. In addition, yield-seeking traders have benefited from high DeFi yields for stablecoins and high DEX yields as these tokens often represent the most commonly swapped tokens.
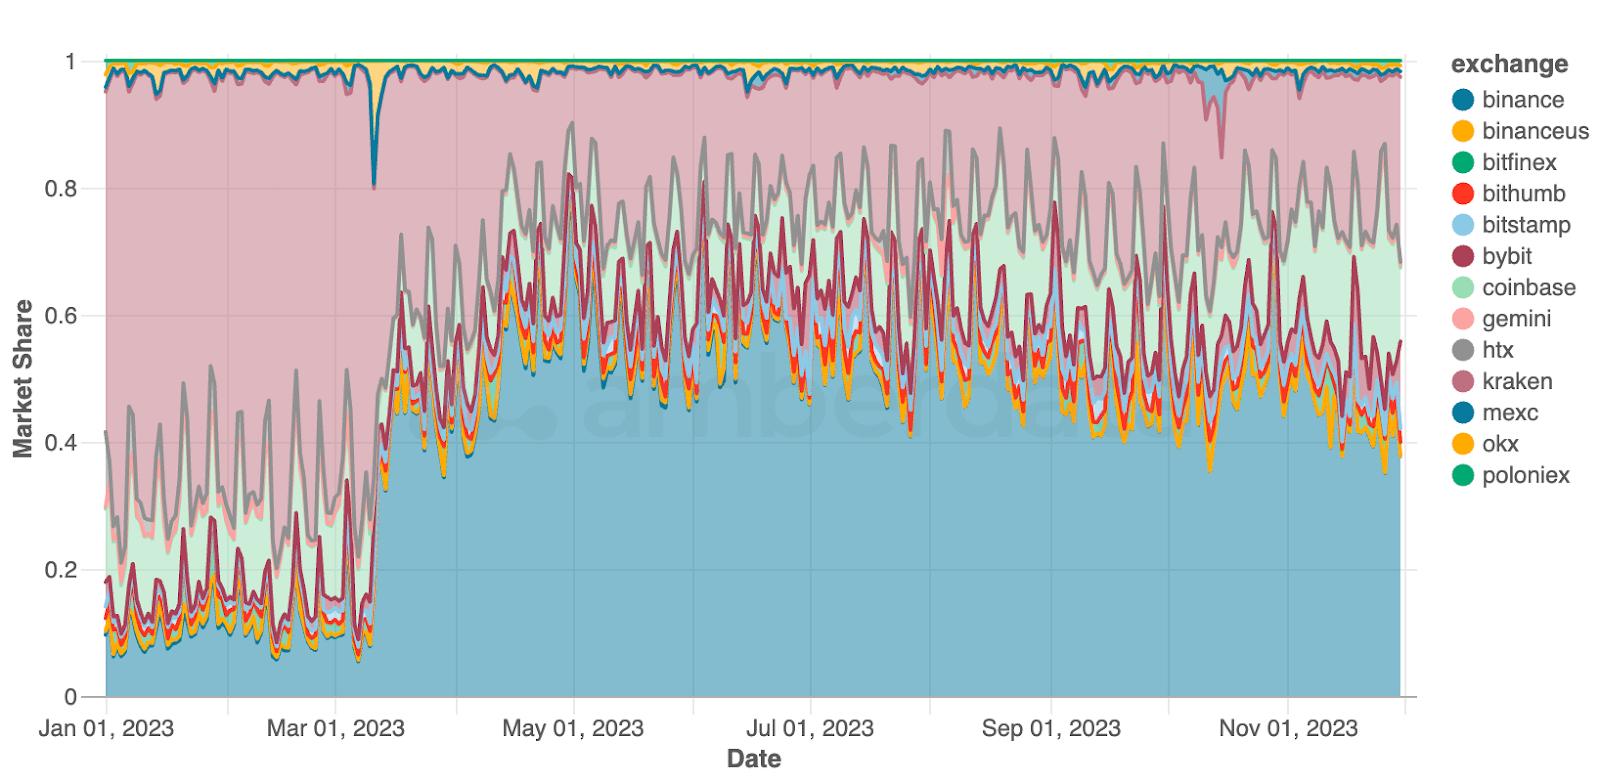
Spot trading volume market share for USDC, USDT, DAI, and TUSD by exchange since Jan 2023
Kraken’s dominance with USDT trading pairs came to an end as Binance’s support for USDC and TUSD helped the CEX behemoth grow its share of stablecoin trading volumes. The centralized exchange ended the year with over 40% daily trading volume market share, while Coinbase picked up steam in the last quarter likely due to ETF events driving overall volumes.
DEX Trading
DEX Trading of stablecoins can provide us with great insights into where funds are being reallocated, or when users are taking a more “risk on” approach to holding. Specifically looking at TVL for DAI, USDC, and USDT across Uniswap v2, Uniswap v3, and Sushiswap, we can see how LPs are holding capital.
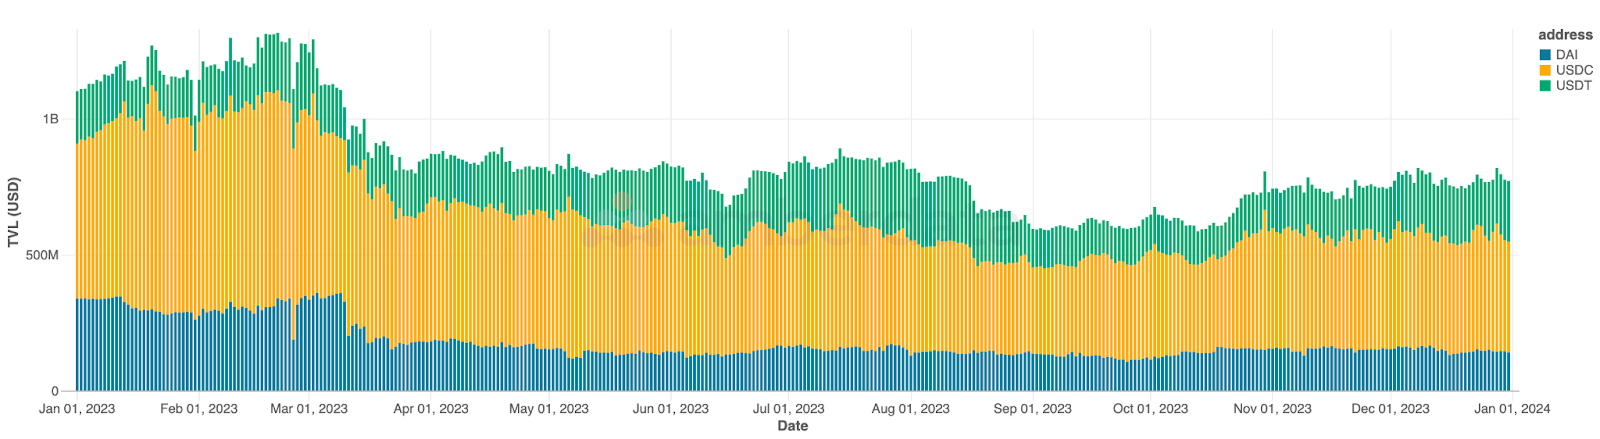
Overall TVL on DEXs for USDC, USDT, and DAI over 2023
Concentration of stablecoins on DEXs is primarily USDC based with locked DAI winding down after the first quarter of 2023. What is interesting here is how the bull-run affected stablecoin TVL on DEXs as one may assume that TVL would decrease, allowing LP’s to swap into more risky positions with the hope of price rises. However, what we see is that USDC and USDT TVL increased in October through the rest of the year – LP’s are likely betting on higher swap volumes generating yield, a trade-off which simplifies holder’s forecasts as there is no need to time market tops or bottoms. This allows traders to take directional risk while benefiting from fee revenue sharing.
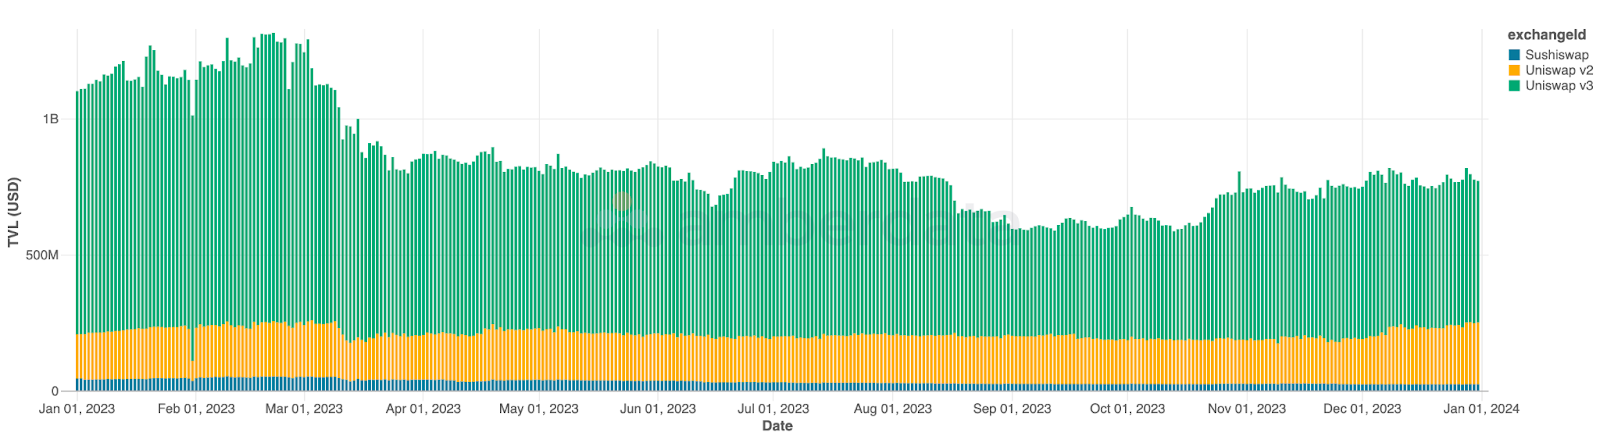
Overall TVL by DEX for USDC, USDT, and DAI over 2023
Not surprisingly, Uniswap v3 was the largest accumulator of liquidity, far outpacing Uniswap v2 and Sushiswap for TVL.
DeFi Lending
One of the primary use cases for stablecoins is yield generation through DeFI Lending protocols. The benefit of using the stablecoins as collateral for borrowing is that these tokens often hold their value (and therefore are less likely to be liquidated) much better than volatile tokens. Below we look at stablecoin activity on DeFi protocols, specifically DAI, USDC, and USDT on Ethereum.
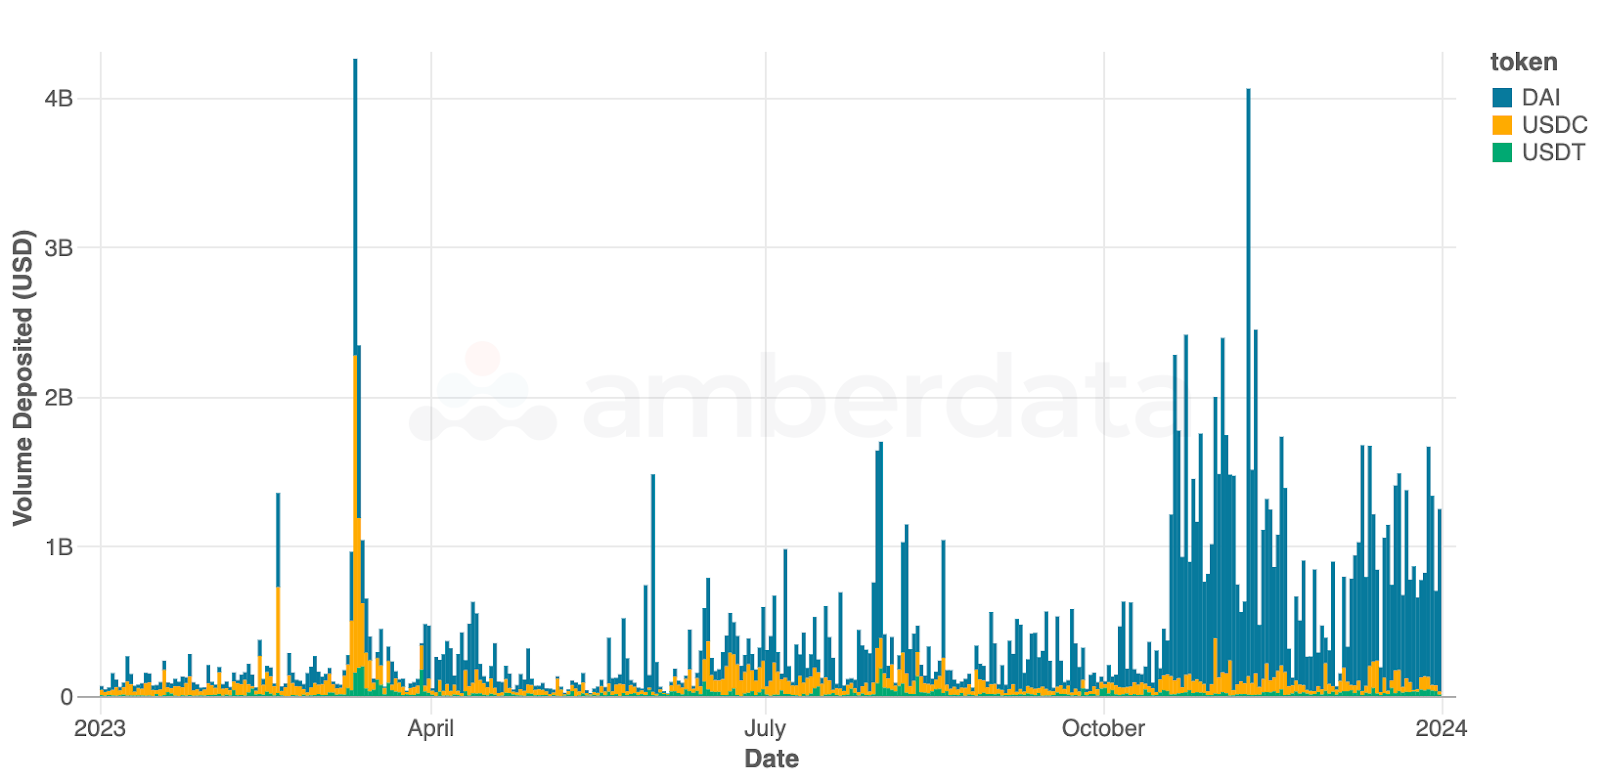
Daily deposits for USDC, USDT, and DAI into DeFi protocols over 2023
Deposits into DeFi protocols exploded during the bull run in late 2023.
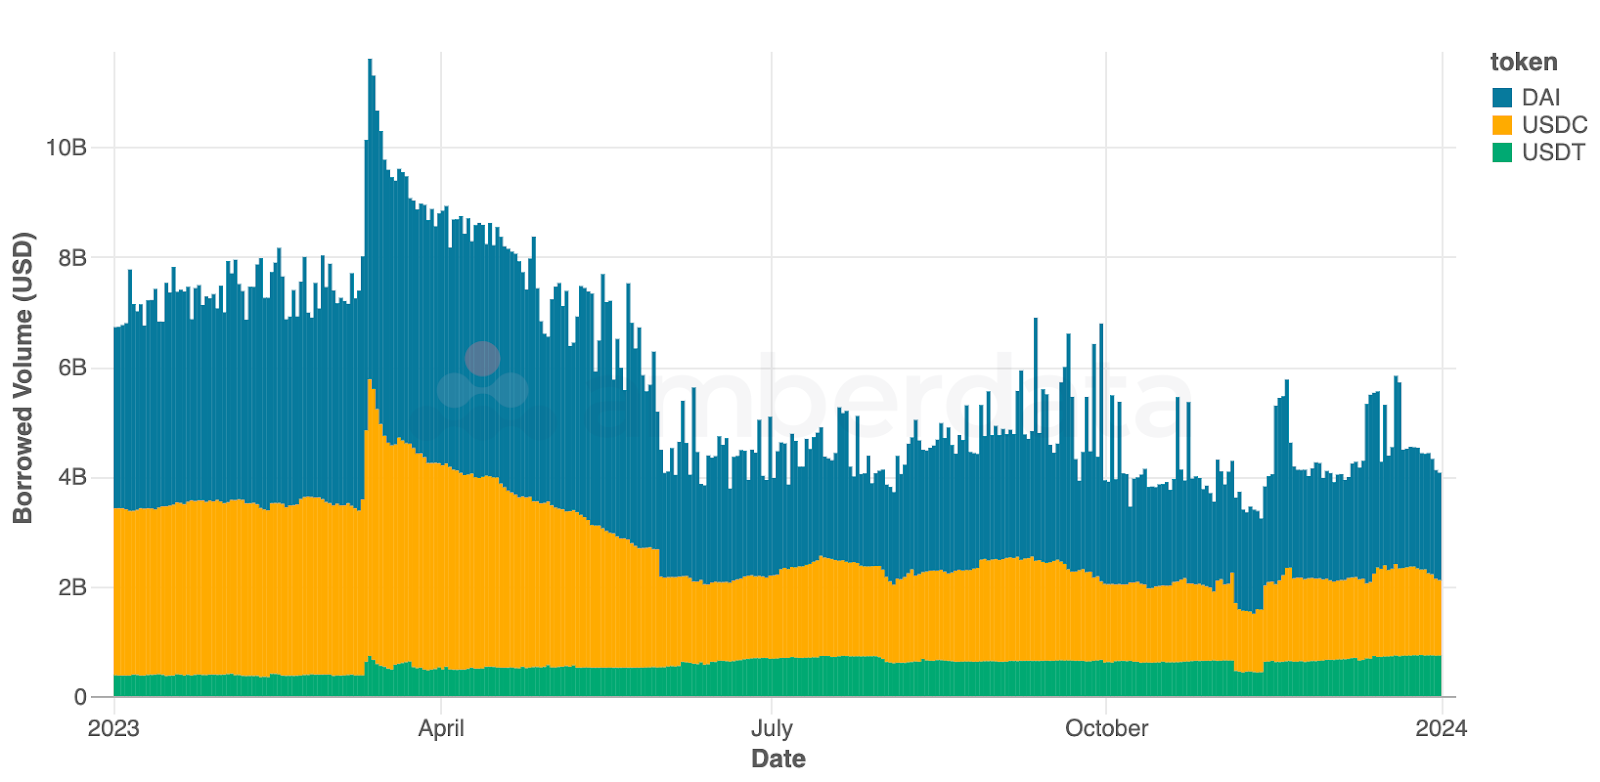
Overall borrowed volumes for USDC, USDT, and DAI into DeFi protocols over 2023
In addition to the increased deposit volume, we also saw that there was no dramatic increase in borrowed volumes of stablecoins on these protocols. It is interesting to point out that (as we saw earlier) stablecoin swaps increased during this timeframe, but stablecoin borrows did not increase. Possible reasons for this include: (1) stablecoin yield was higher than yields outside of DeFi so users were lending more to generate passive yield, or (2) users were depositing stablecoins to borrow other tokens (to trade or for price action), or (3) stablecoins were being used pay-off existing loans (which we’ll explore later).
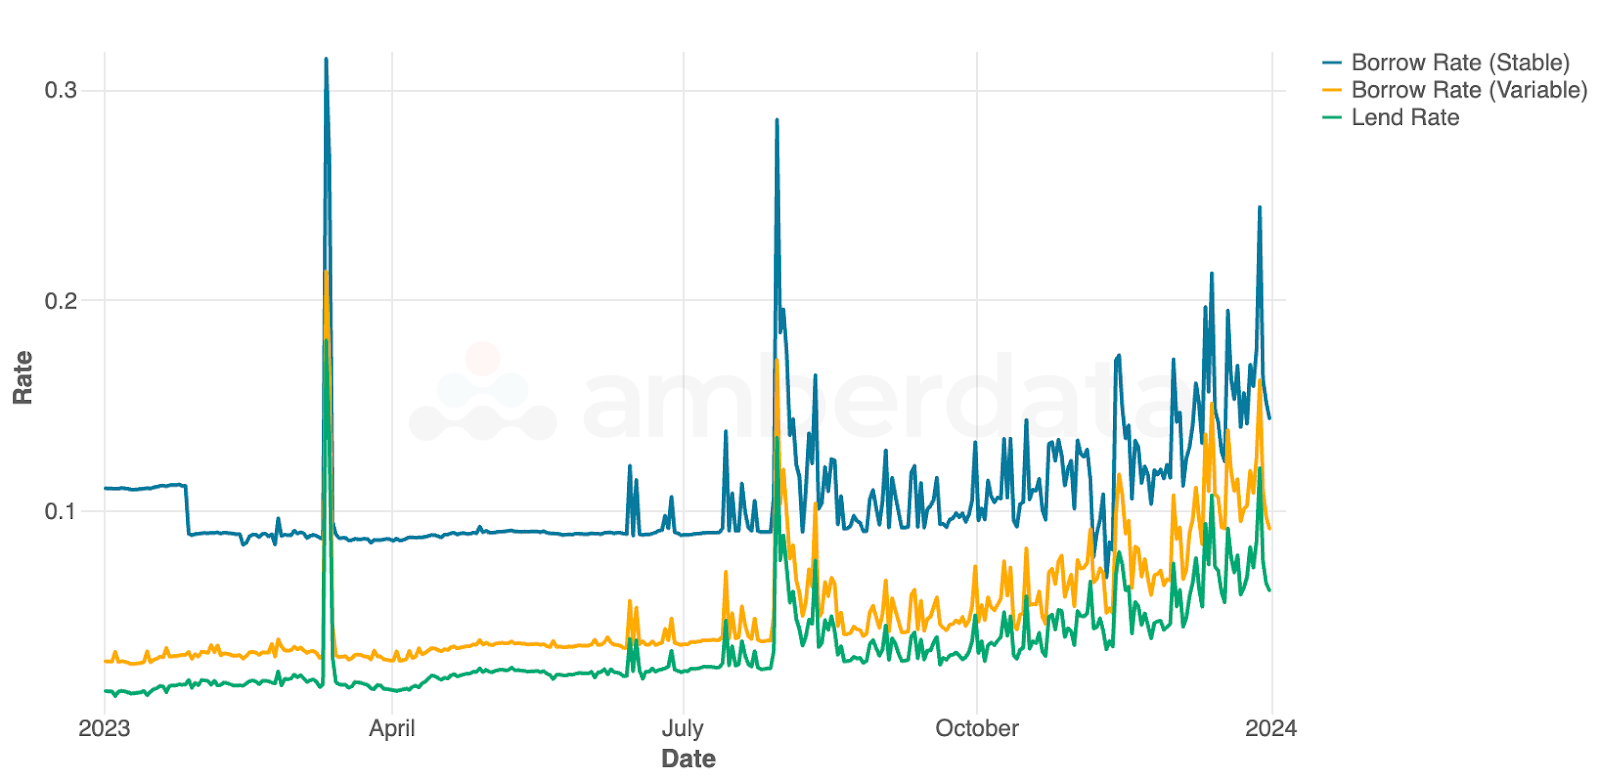
Average stablecoin rates for USDC, USDT, and DAI on DeFi protocols over 2023
Looking at average stablecoin rates for borrowing and lending, the overall environment leads to increases in stable and variable borrow rates, as well as rates to lend. There’s a possibility that more users began to lend these stablecoins on various protocols to generate a passive ~10% APY. Keep in mind that these rates above represent average rates across protocols, with some protocols offering higher rates.
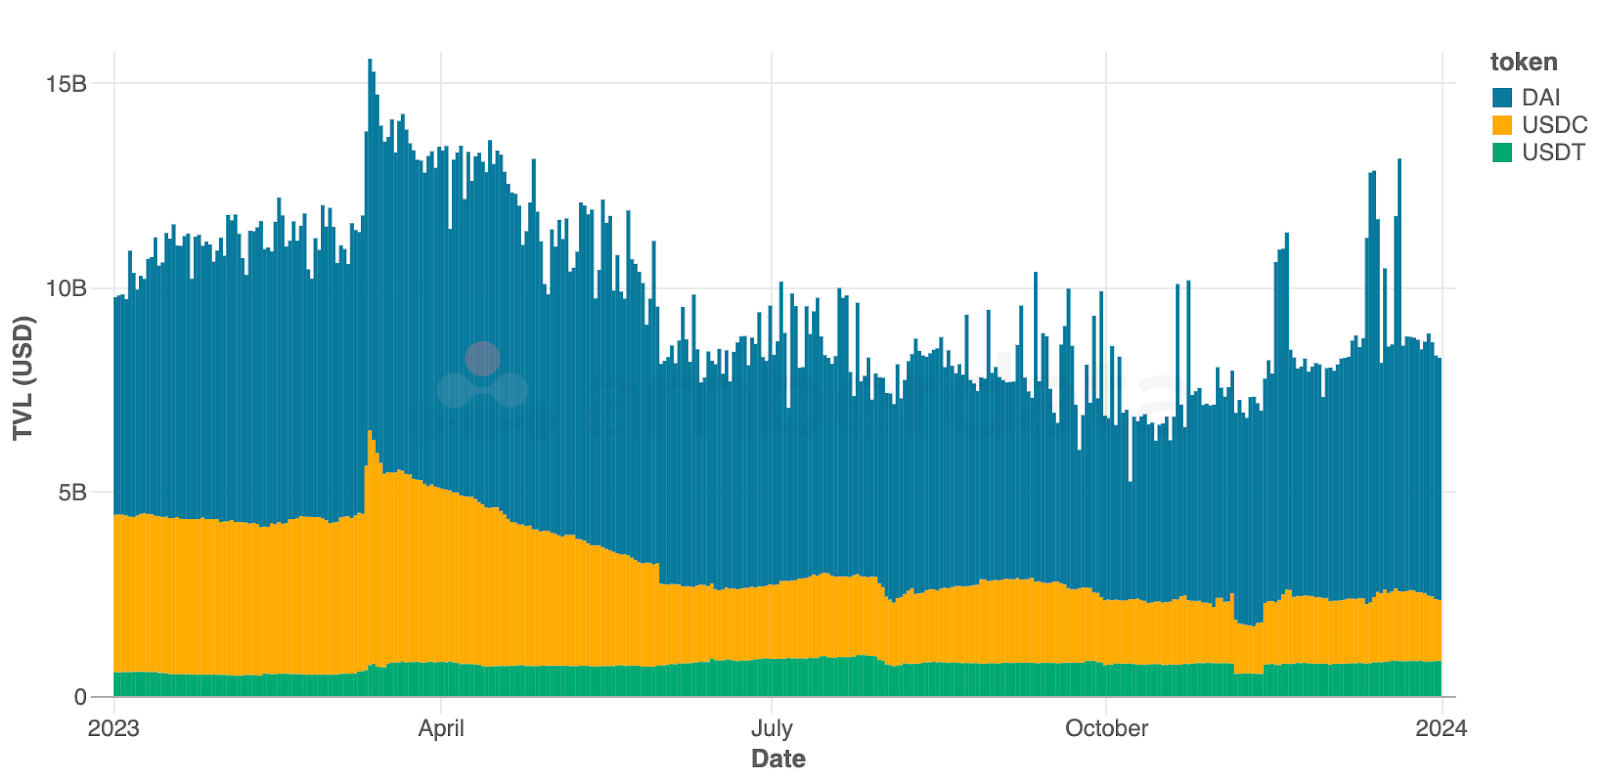
USDC, USDT, and DAI TVL on DeFi protocols over 2023
TVL during this time also ran up higher, giving credence to the thought that users were likely depositing funds for passive yield generation or borrowing other tokens. In any case, DAI is often the most deposited token due to the inclusion of MakerDAO in this analysis. But USDC and USDT TVL remained fairly stable throughout the year post-June 2023 similar to trends we’ve seen on DEXs.
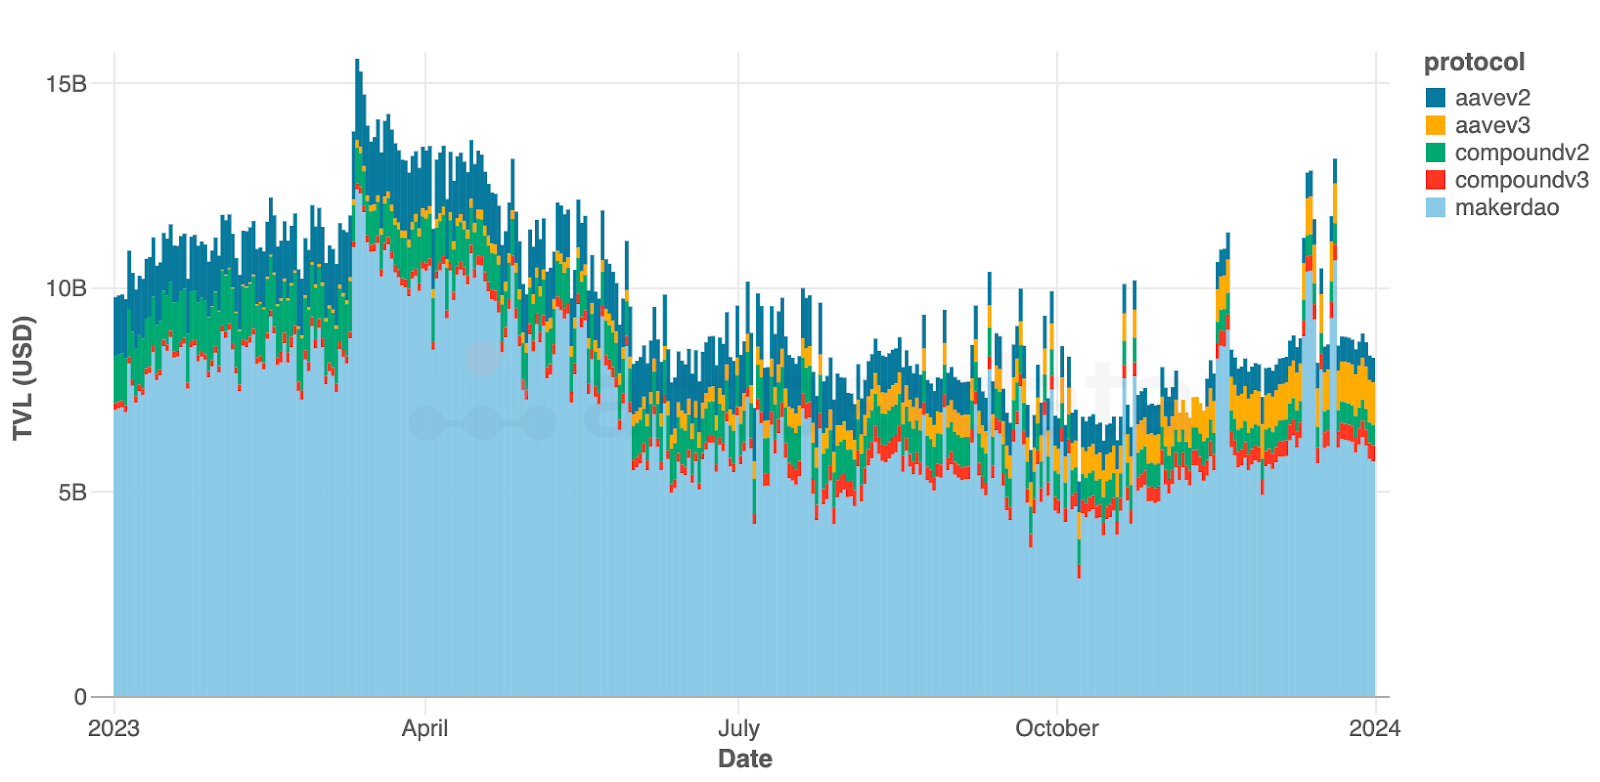
USDC, USDT, and DAI TVL on various DeFi protocols over 2023
Setting aside MakerDAO (whose volume is closely tied to overall DAI deposits), we can see Aave v3 picking up steam in the second half of the year after launching on Ethereum earlier in 2023, though Aave v2 remains dominant, keeping pace with Compound v2 and v3. Compound v3 also gained momentum in the second half of the year after launching on Ethereum in 2022.
To read the full report, click here.
Legal and Disclosures
Disclaimers
The information contained in this report is provided by Amberdata solely for educational and informational purposes. The contents of this report should not be construed as financial, investment, legal, tax, or any other form of professional advice. Amberdata does not provide personalized recommendations; any opinions or suggestions expressed in this report are for general informational purposes only.
Although Amberdata has made every effort to ensure the accuracy and completeness of the information provided, it cannot be held responsible for any errors, omissions, inaccuracies, or outdated information. Market conditions, regulations, and laws are subject to change, and readers should perform their own research and consult with a qualified professional before making any financial decisions or taking any actions based on the information provided in this report.
Past performance is not indicative of future results, and any investments discussed or mentioned in this report may not be suitable for all individuals or circumstances. Investing involves risks, and the value of investments can go up or down. Amberdata disclaims any liability for any loss or damage that may arise from the use of, or reliance on, the information contained in this report.
By accessing and using the information provided in this report, you agree to indemnify and hold harmless Amberdata, its affiliates, and their respective officers, directors, employees, and agents from and against any and all claims, losses, liabilities, damages, or expenses (including reasonable attorney’s fees) arising from your use of or reliance on the information contained herein.
Copyright © 2024 Amberdata. All rights reserved.
