Share this blog:
To say the last two weeks were eventful is a monumental understatement. Here are some of the biggest headlines:
The trial of Sam Bankman-Fried, former founder and CEO of Alameda Research and FTX, has finally ended with the once-celebrated frontman found guilty on all seven counts. Prosecutors are now focusing on a possible second trial that could level charges including campaign financing violations, Chinese official bribery (Foreign Corrupt Practices Act charges), witness tampering, and possible charges against other co-conspirators and family. While this case was old-fashioned fraud, the industry needs to improve.
After a congressional request, the US Government Accountability Office (GAO) has submitted a review for Congress that the SEC did not, as required by the Congressional Review Act (CRA), submit Staff Accounting Bulletin No.121 to the House of Representatives for review before acting on the Bulletin. Due to its requirements for companies that custody crypto on behalf of customers to report these holdings on balance sheets as liabilities, the Bulletin is highly controversial.
The FBI, Homeland Security Investigations (HSI), and Internal Revenue Service Criminal Investigation (IRS) have arrested and charged the founders of SafeMoon (SFM). The SEC has also charged the company and executive team for fraud and Unregistered Officer of Crypto Securities, in the same week they issued a subpoena to PayPal over their recently launched stablecoin PYUSD.
Spot Market
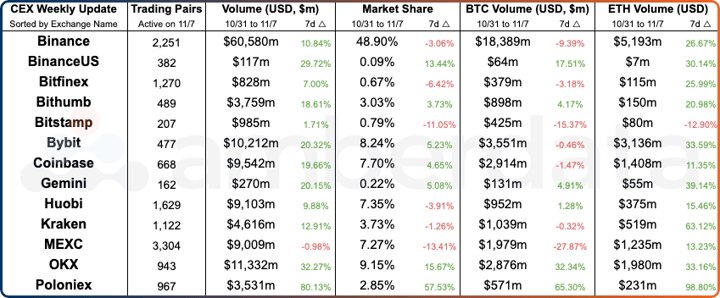
Centralized Exchange (CEX) comparisons from weeks 10/31/2023 and 11/07/2023.
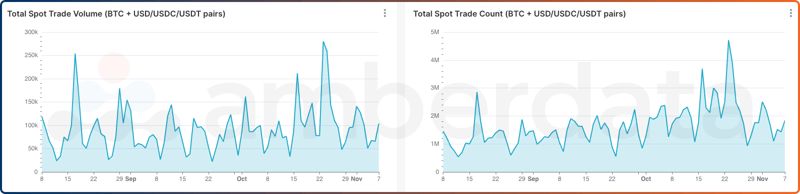
Centralized Exchange (CEX) trading volume and trade count for key BTC pairs weeks over the last 30 days.
Trading has returned to centralized exchanges which are likely in desperate need of volumes after a long dry spell. Discord channels, signal groups, telegraph threads, and slack messages have been celebrating, but longer-term data shows that unfortunately, the market is far from back.
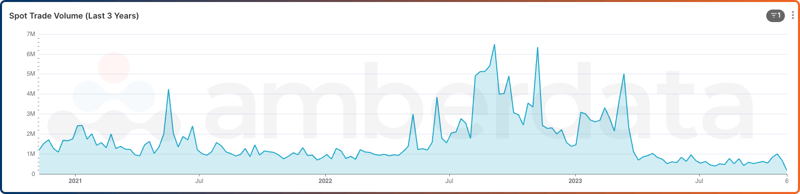
Centralized Exchange (CEX) weekly trading volume for key BTC pairs (BTC/USD, BTC/USDC, BTC/USDT) over the last 3 years.
Trading volumes for key BTC pairs (BTC/USD, BTC/USDC, BTC/USDT) across centralized exchanges have yet to return to 2021 levels and are far from the summer 2022 peaks which brought several waves of sell-offs, bankruptcies, business collapses, and more. BTC prices have returned to solid levels, but trading volume is a key ingredient to healthy markets that have yet to rebound.
DeFi DEXs

Decentralized Exchange (DEX) protocol from weeks 10/31/2023 and 11/07/2023.
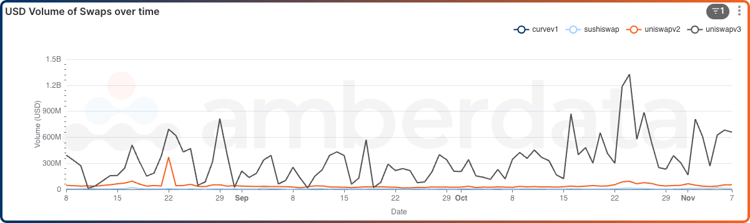
Decentralized Exchange (DEX) trading volume over the last 3 months.
DEXs are also seeing an uptick in trading volume. Uniswap v3 has especially seen a huge increase in volume since August and September. These signals are the first step to a returning bull market, but as CEX trading volumes have been low the last few weeks, there is still a long way to go.
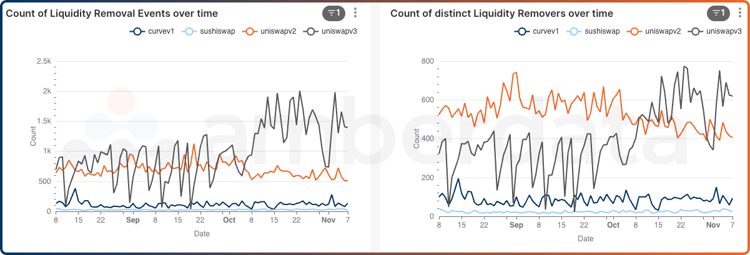
Decentralized Exchange (DEX) liquidity removal daily event counts and unique addresses for the last 3 months
A potentially leading metric for trading volumes is liquidity removal events, addresses, and volumes. Over the last several months we have seen liquidity in DEXs and lending pools grow as users seek yields in any way they can, and with trading dryer than it has been, passive yield has been a useful layover for many. With the rise in crypto prices, users appear to be trading on the increased liquidity the market is providing by pulling funds from passive yield positions into more actively-managed trading strategies.
DeFi Lending/Borrowing
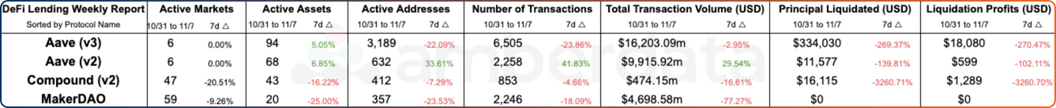
DeFi Lending protocol comparisons from weeks 10/31/2023 and 11/07/2023.
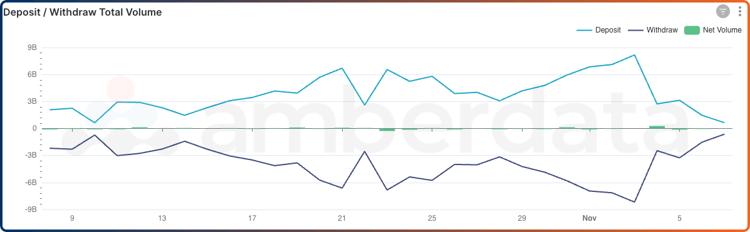
DeFi Lending deposit and withdrawal daily volumes for the last 30 days.
DeFi Lending paints an interesting story when it comes to volatile and up-markets. As users seek liquidity from passive lending to active trading, they are choosing to either remove liquidity from lending pools for trading or are borrowing against their collateral for trading. The last few weeks have seen a growth in deposit and withdrawal volumes, with deposits netting slightly higher overall.
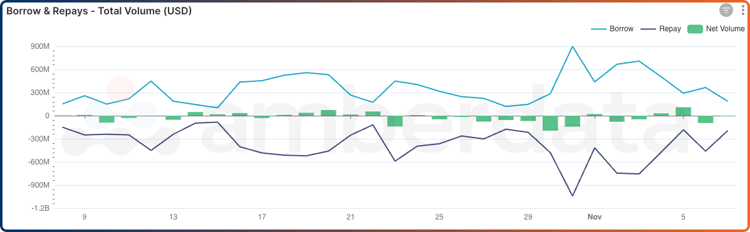
DeFi Lending borrow and repayment daily volumes for the last 30 days.
In terms of borrow and repayment volumes, the mixed signal has leaned towards repayment of previously borrowed funds. This indicates that users may be selling the tokens they’ve bought from previous loans and taking gains, or that they are consolidating positions to gain an edge in yields elsewhere. From a macro perspective, the rise in volumes is a great signal for health and the last few days have been a nice sign for lending platforms.
Networks
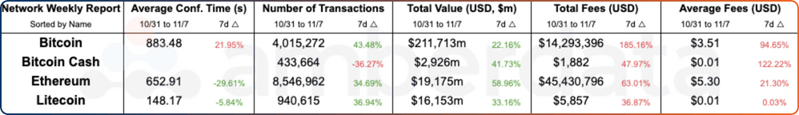
Network comparisons from weeks 10/31/2023 and 11/07/2023.
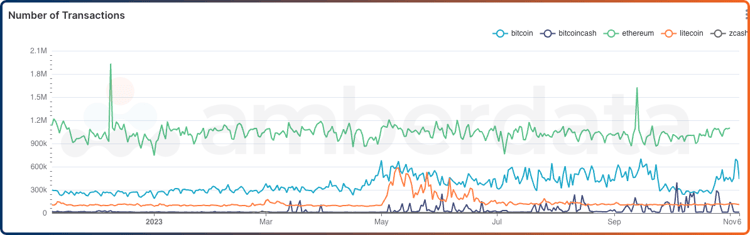
Bitcoin’s network transaction volume suffered a dip between the end of September and the middle of October, with volumes reflecting that of 2022. This may be a sign of the ordinals market slowing down, which has brought a major bump in on-chain transaction activity since April 2023. However, with the recent price increases, it looks like Bitcoin transaction volume has returned to levels held since May 2023. This is an interesting indication that price increases can lead to network usage even on the token known best for long term investments and as a replacement for gold.
Links
Recent Coverage
- The Currency Analytics: Bitcoin Bulls Stay Strong After Weak Payroll Data: Experts Weigh In on Crypto’s Bright Future
- Forbes: Bitcoin Prices Have Rallied Over 20% In October As ETF Anticipation Fueled Gains
- Crypto News BTC: Bitcoin Prices Have Rallied Over 20% In October As ETF Anticipation Fueled Gains
Spot Market
Spot market charts were built using the following endpoints:
- https://docs.amberdata.io/reference/market-metrics-exchanges-volumes-historical
- https://docs.amberdata.io/reference/market-metrics-exchanges-assets-volumes-historical
- https://docs.amberdata.io/reference/get-market-pairs
- https://docs.amberdata.io/reference/get-historical-ohlc
Futures
Futures/Swaps charts were built using the following endpoints:
- https://docs.amberdata.io/reference/futures-exchanges-pairs
- https://docs.amberdata.io/reference/futures-ohlcv-historical
- https://docs.amberdata.io/reference/futures-funding-rates-historical
- https://docs.amberdata.io/reference/futures-long-short-ratio-historical
- https://docs.amberdata.io/reference/swaps-exchanges-reference
- https://docs.amberdata.io/reference/swaps-ohlcv-historical
- https://docs.amberdata.io/reference/swaps-funding-rates-historical
DeFi DEXs
DeFi DEX charts were built using the following endpoints:
- https://docs.amberdata.io/reference/defi-dex-liquidity
- https://docs.amberdata.io/reference/defi-dex-metrics
DeFi Borrow/Lend
DeFi lending charts were built using the following endpoints:
- https://docs.amberdata.io/reference/defi-lending-protocol-lens
- https://docs.amberdata.io/reference/defi-lending-asset-lens
Networks
Network charts were built using the following endpoints:
- https://docs.amberdata.io/reference/blockchains-metrics-latest
- https://docs.amberdata.io/reference/transactions-metrics-historical
- https://docs.amberdata.io/reference/get-historical-transaction-volume
