Share this blog:

Gain an edge in crypto options trading by analyzing implied volatility over time rather than relying on static snapshots. By leveraging Amberdata’s time-lapse tools, traders can identify recurring patterns, anticipate volatility shifts, and optimize their strategies with greater confidence. Learn all about implied volatility surfaces:
Introduction
In crypto trading, implied volatility surfaces describe how IV differs across various strike prices and maturities. When IV is examined only in real time—say, just before a big economic announcement—an observer sees only one moment in a continuously shifting environment. This one-off view might provide a glimpse of relative pricing for calls versus puts, but it cannot fully reveal recurring patterns that form across days or weeks.
A time-lapse perspective, by contrast, compares multiple snapshots of implied volatility surfaces over a range of dates (or even hours). It’s somewhat like replaying weather data to understand the path of a storm front, rather than looking at a single radar image. With time-lapse analysis, traders can detect whether near-term expirations always spike before major announcements, or if the entire term structure flattens at a predictable time each quarter.
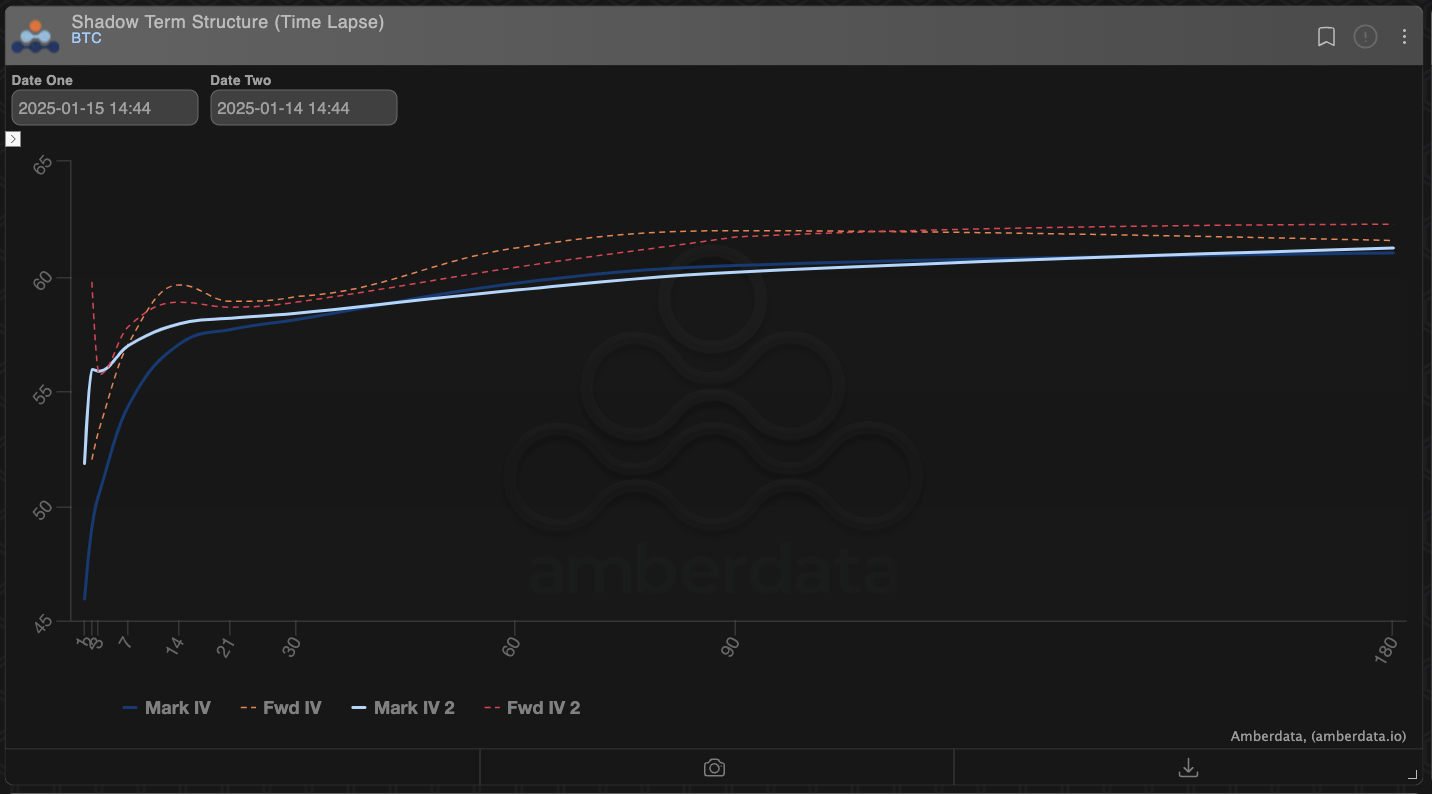
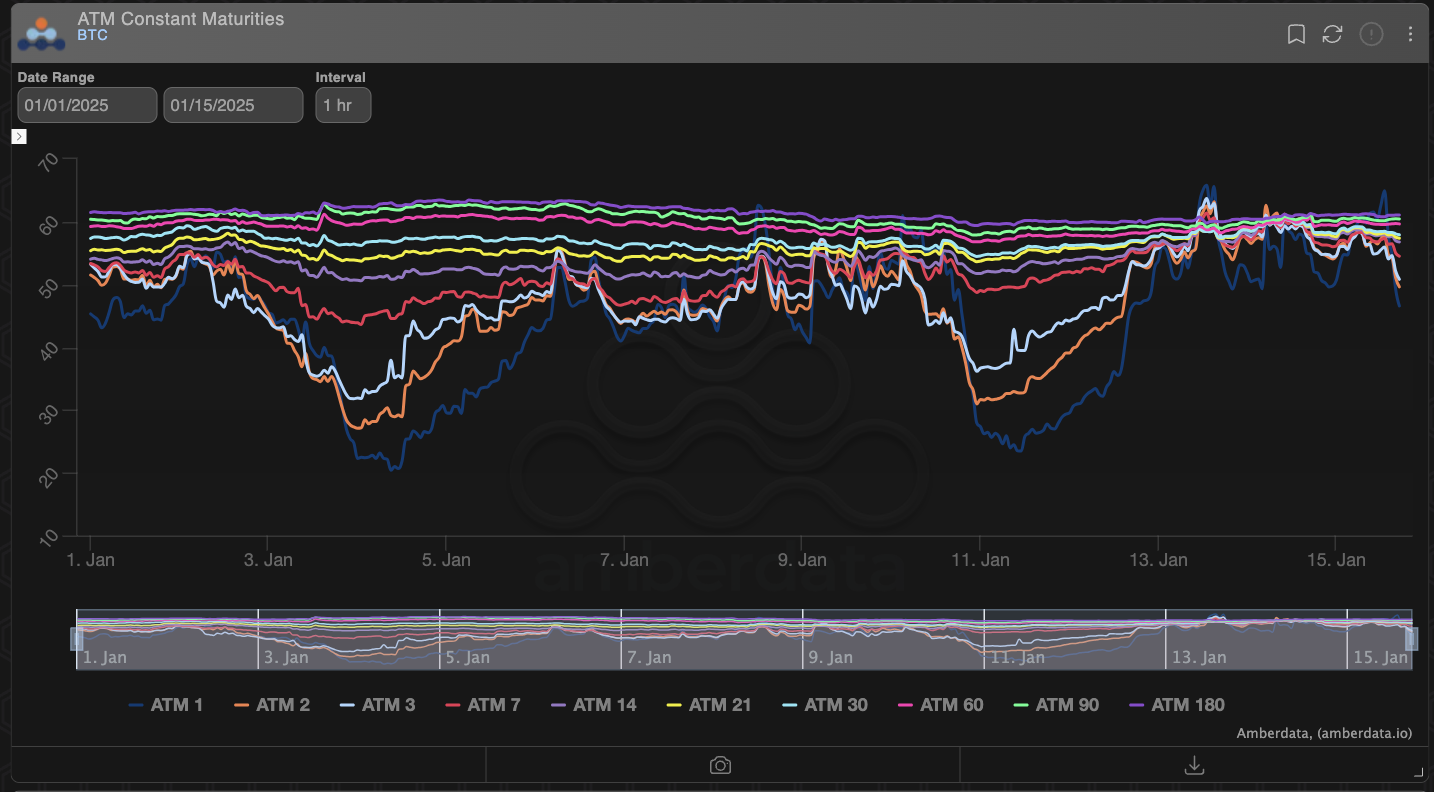
Amberdata makes these comparisons straightforward by offering specialized tools. For instance, the Shadow Term Structure (Time Lapse) chart tracks changes in Mark IV and Forward IV across different tenors, while the ATM Constant Maturities tool allows you to compare implied volatilities for at-the-money options across short, medium, and longer horizons. Below, we’ll explore how traders benefit from these visualizations and why seasonal or cyclical patterns might appear in crypto markets.
Using Time-Lapse Volatility Surfaces to Identify Patterns
The Value of Mark IV and Forward IV Over Time
At a practical level, a time-lapse volatility surface shows how implied volatilities for multiple maturities shift as market sentiment, news events, and hedging flows change. Rather than relying on day-old data or a static snapshot, traders can map how the implied volatility curve has moved hour by hour or day by day.
On Amberdata’s Shadow Term Structure (Time Lapse) chart, you might notice that near-term maturities (e.g., options expiring within seven days) often show sharper IV swings. Meanwhile, options with longer expirations can hold steadier, unless a major market-moving event is weeks away. This flexibility matters because changes in Forward IV—where traders place their bets on more distant timelines—sometimes hint at growing concerns or optimism about the market’s future state.
Spotting Event-Driven Volatility Clustering
Events that significantly influence price can also leave distinct footprints in time-lapse volatility data. For instance, if implied volatilities tend to rise three days before a scheduled economic report, that pattern may repeat month after month. By studying the time-lapse progression, a trader has a clearer sense of exactly when (and for which maturities) these spikes occur.
Another common example is the buildup around protocol upgrades. If the market anticipates large swings tied to a high-profile network change, the shorter-dated portion of the curve might see a bigger jump in IV. Recognizing this clustering ahead of time allows traders to assess potential strategies—like entering option spreads before the surge becomes fully priced in.
Leveraging Seasonal Patterns for Strategy Optimization
ATM Constant Maturities for Consistent Signals
Though crypto markets don’t follow a classic agricultural or manufacturing cycle, there are still repeatable phenomena—such as monthly options expirations or consistent news calendars—that can create seasonal volatility. Looking at ATM Constant Maturities (e.g., the 7-day, 14-day, 30-day, 60-day, or 90-day lines) reveals if any particular horizon exhibits a recurring bump. If the data shows a pattern of rising implied volatility around certain times, a trader can anticipate the resulting changes in options pricing.
Practical Applications for Traders
- Long Straddles: A straddle involves buying both a call and a put at the same strike. If time-lapse data suggests implied volatility will jump in the days before an event, purchasing a long straddle just before that window could prove beneficial. The trader hopes to sell it once IV has spiked.
- Delta-Neutral Strategies: If you prefer not to take a directional stance on the underlying crypto asset, delta-hedged trades rely on volatility changes for profit. For instance, if monthly data shows repeated IV increases for 30-day maturities, you might open a position designed to profit from that rise, without exposing yourself to large directional swings.
- Calendar Spreads: Calendar spreads involve taking positions in different maturities simultaneously. If the near-term IV always surges before an event and the longer-term IV remains subdued, a calendar spread may gain value as one leg appreciates faster than the other.
By using data from these repetitive cycles, you move away from guesswork and toward a data-driven process.
Enhancing Resilience Against Predictable Fluctuations
Building Hedges Around Known Cycles
Recurring IV spikes can catch some traders off-guard, particularly if they’re focused only on spot prices. Relying on time-lapse analysis to anticipate these fluctuations enables more effective hedging. For instance, if the Shadow Term Structure (Time Lapse) consistently shows a steepening curve in the week before each monthly expiration, one might purchase out-of-the-money puts or calls in anticipation of that price swing (or implied volatility surge).
Historical IV Evolution for Better Risk Management
Amberdata’s historical data also provides a reliable foundation for analyzing past patterns. By revisiting previous major events, you can determine whether a surge in implied volatility is a one-off or a trend. If the same maturity spikes around the same date in multiple months, it’s less likely to be a coincidence. Knowing these patterns helps with timely entries and exits, avoiding emotional decisions during sudden price moves.
Even a robust plan doesn’t protect you from all surprises, since unforeseen news can derail carefully laid strategies. Nevertheless, building resilience around predictable events is far better than ignoring the patterns and reacting in haste. Traders who combine time-lapse IV data with other metrics—like volatility surfaces, trading volume, and open interest—are in a stronger position to weather sudden reversals.
Conclusion
Examining implied volatility surfaces at a single point in time can be helpful, but it rarely conveys the full narrative. By adopting a time-lapse perspective, traders can pinpoint recurring cycles and identify moments when IV has historically surged or dipped. These patterns often revolve around scheduled events—like macroeconomic announcements or protocol upgrades—and can be surprisingly consistent across different maturities.
Tools like Amberdata’s Shadow Term Structure (Time Lapse) and ATM Constant Maturities make these observations accessible, painting a clear picture of how IV ebbs and flows over days or weeks. Rather than relying on hunches, traders can gain insights from this data to structure positions in crypto options more effectively. Strategies like long straddles, delta-neutral positions, and calendar spreads all stand to benefit from better timing, especially when combined with an awareness of typical volatility cycles.
Preparing for these shifts ahead of time can also improve risk management. By hedging or adjusting exposures based on known patterns, traders can mitigate the adverse effects of rapid market changes. At the same time, recognizing the market’s historical responses can help refine entries and exits—a vital element when volatility spikes occur with little warning.
Overall, time-lapse analysis brings a greater level of nuance to implied volatility analysis. Whether the goal is to capture upside in predictable volatility surges or to avoid losses when markets move in a familiar pattern, the key is to look beyond a single IV snapshot. Understanding how implied volatility surfaces evolve—in real time and historically—offers a deeper level of insight into potential market turns. With this knowledge, traders can adapt more confidently, integrating the data into strategies for funding rate arbitrage or other sophisticated approaches.
By weaving these elements together, anyone involved in crypto derivatives can remain agile in a market that never sleeps—an especially crucial skill given the rapid shifts in sentiment and liquidity that define digital asset trading.
