Share this blog:
Want to dive deeper into how traders use cross-asset analysis to identify opportunities in BTC and ETH markets? Keep reading to explore key insights and strategies.
Introduction
Cross-asset analysis is not new in traditional finance: equities, bonds, and commodities have been evaluated in pairs or groups for decades. However, BTC vs. ETH presents a distinct case, as each has its own ecosystem, liquidity profile, and market drivers. By overlaying their respective volatility surfaces, traders see how implied volatility fluctuates across strikes and expirations for each asset. Some days, BTC options might carry a premium, reflecting heightened uncertainty in Bitcoin’s price. On others, ETH options could spike, perhaps triggered by major network upgrades or correlation to decentralized finance (DeFi) protocols.
Comparing such patterns is the core of relative value trading. If BTC’s implied volatility is significantly higher than ETH’s—without a convincing catalyst—there may be a chance to capture premium from that mismatch. Alternatively, if one believes BTC and ETH tend to mean-revert toward historical correlations, any deviation in implied volatility might be a signal to set up a relative-value trade (sometimes referred to as a spread or pairing strategy) to profit as these volatilities converge again.
Understanding Volatility Surfaces and Their Interrelation
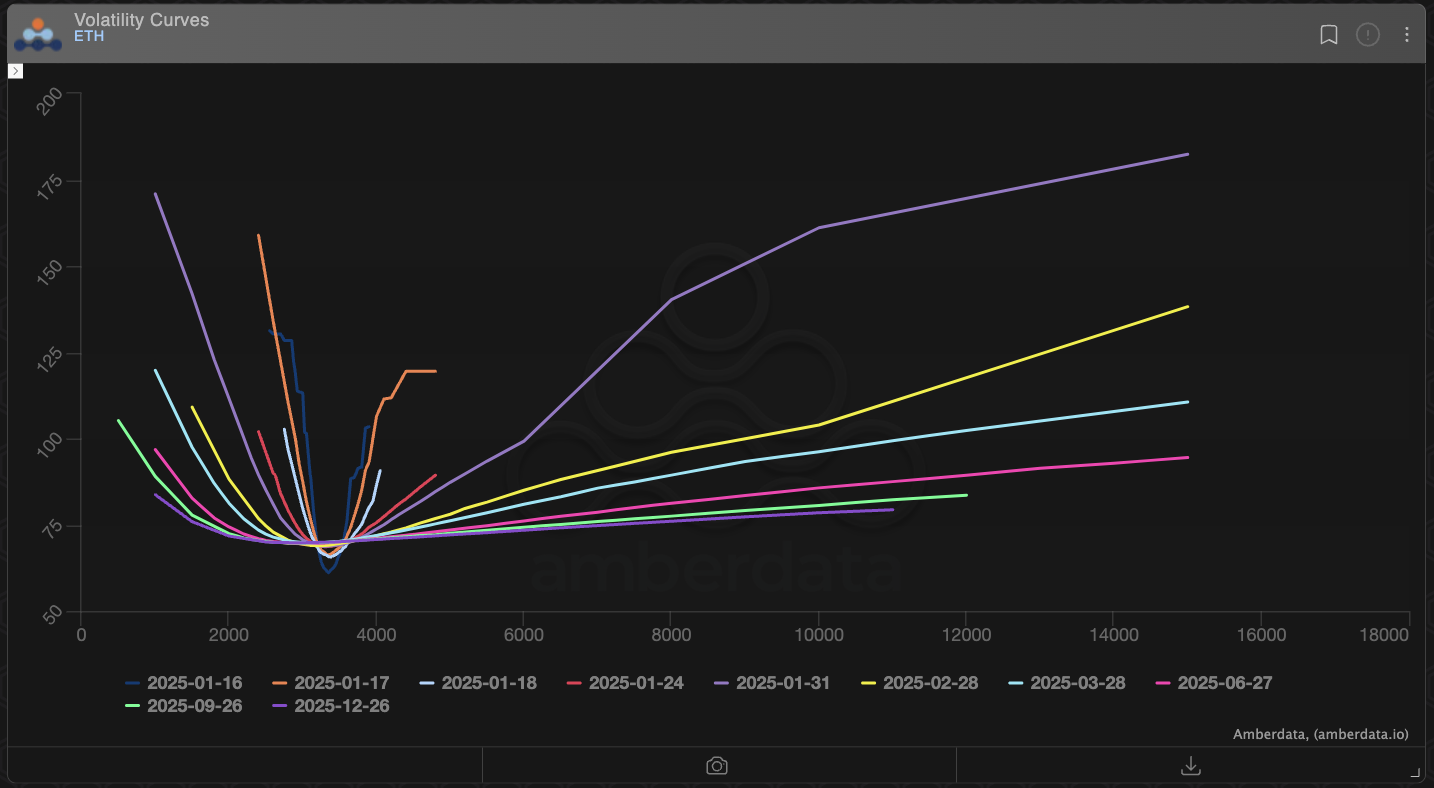
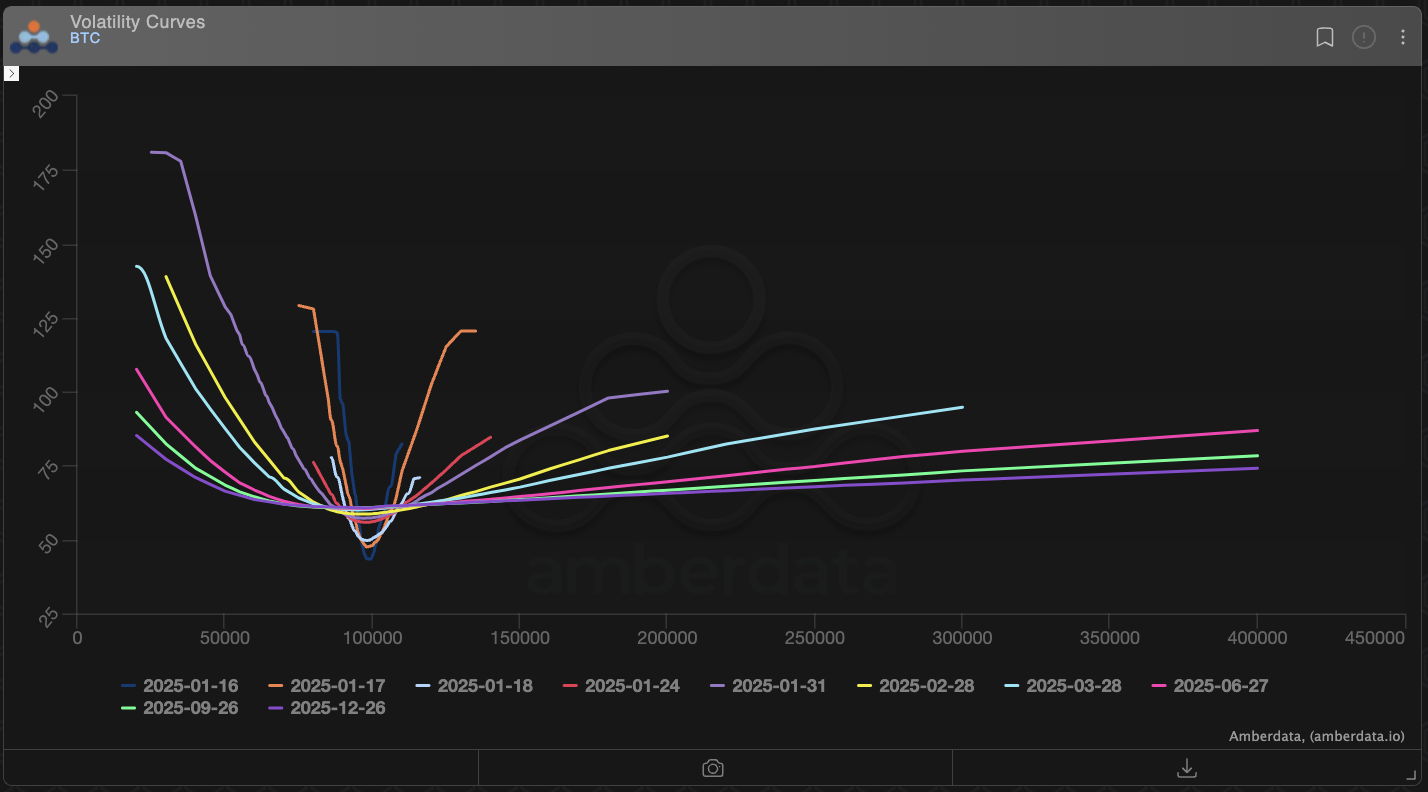
Volatility Surfaces in Brief
A volatility surface illustrates implied volatility values across varying strikes (moneyness) and expirations (time to maturity). Typically, the surface slopes and twists, reflecting how the market prices risk and uncertainty. In a single snapshot, the nearer-term options might show higher volatility if a significant event is imminent—such as an update in monetary policy or a network upgrade. Distant expirations can reveal the market’s long-range expectations of price turbulence or stability.
When analyzing BTC and ETH together, you’re looking for differences in slope, skew, and curvature. Skew, for instance, indicates whether out-of-the-money (OTM) puts are more expensive than OTM calls (or vice versa), and it can differ drastically between BTC and ETH. Term structure, another key attribute, reveals how implied volatility changes from a short-term expiration (one or two weeks) to a longer one (months away).
By noting how these surfaces behave relative to each other, you can spot divergences in the market’s perceived risk. Sometimes these divergences can be explained by a known event, such as a planned protocol update or an upcoming regulatory hearing. Other times, they appear to be momentary inefficiencies, ripe for exploration.
Cross-Asset Insights: BTC vs. ETH
Observing each underlying’s price trajectory isn’t enough—you need the context of how traders are pricing options risk. If the BTC surface consistently prices a steep skew that signals a greater fear of downside, while ETH remains more balanced, one possibility is that participants foresee bigger tail-risks in Bitcoin (perhaps due to macro correlations). Conversely, Ethereum’s implied volatilities might surge on speculation of DeFi expansions or network shifts, even if Bitcoin’s surface remains calm.
By correlating these curves, traders gain deeper insight into the market’s collective psyche: which asset is seen as riskier, which is more likely to experience a volatility shock, and how that dynamic fluctuates over time. These observations form the basis of cross-asset analysis and can lead directly to informed relative-value trading strategies.
Identifying Arbitrage and Relative-Value Opportunities
Recognizing Spread Trades
A relative-value trade often takes the form of a spread. Instead of going long on BTC options and ignoring ETH (or vice versa), a spread might involve going long on one asset’s volatility while shorting the other’s. The objective? To profit if implied volatilities converge to a historical average—or if the spread between them widens in a predictable manner. This approach can reduce exposure to general market direction, focusing instead on the relationship between the two volatility surfaces.
For example, if BTC implied vol is unusually high while ETH implied vol remains muted, a trader anticipating mean reversion could buy ETH calls while simultaneously selling BTC calls. If the implied vol difference narrows, the relative-value position may become profitable—even if both BTC and ETH remain range-bound.
Arbitrage and Mean Reversion
Market participants sometimes spot short-lived arbitrage conditions when one exchange or one asset’s implied vol is momentarily out of line with broader market pricing. Quick moves can exploit these differences before they normalize. Sustained mean reversion trades, on the other hand, might not require an obvious error in pricing. Instead, they’re built on the idea that BTC and ETH volatilities follow correlated but distinct paths and thus gravitate back to each other’s historical levels over time.
While these strategies can be rewarding, they also entail careful risk management. If a macro event—like surprising employment data or key central-bank announcements—suddenly jolts crypto markets in a direction that disproportionately affects BTC or ETH, a cross-asset spread can face larger losses. That’s why traders often monitor additional signals, such as crypto and elections or macro-level developments, to avoid being blindsided by the unexpected.
Constructing Effective Trading Strategies
Combining Cross-Asset Volatility with Other Factors
Volatility does not exist in isolation. Advanced traders often incorporate other data—such as on-chain metrics, sentiment indicators, or funding rate arbitrage—to refine or hedge their positions. For instance, if on-chain analysis suggests a large inflow of ETH to exchanges before a big upgrade, you might predict an uptick in ETH implied volatility. At the same time, BTC’s implied volatility may remain stable if no analogous driver is looming.
In these scenarios, comparative volatility analysis using Amberdata’s specialized dashboards can make the difference between guessing and acting on a data-driven thesis. By overlaying the volatility surfaces of BTC and ETH, traders can observe how each shifts over time and identify the best timing to put on a cross-asset spread.
Long/Short Volatility Pairs and Other Spreads
A popular method is a long/short volatility pair. You might, for example, buy an out-of-the-money call on BTC while selling an equivalent call on ETH, adjusting the position sizes according to each asset’s volatility profile. Your net delta exposure can be balanced so that the trade focuses on differences in implied volatility rather than absolute price direction. If the market unexpectedly rallies or drops in tandem, your paired position could remain relatively balanced, as gains on one side offset losses on the other.
Hedging techniques also play a role. If you worry that your cross-asset position might be vulnerable to a drastic move in one underlying asset, you can layer in futures or additional options to cap potential drawdowns. Traders might even combine cross-asset volatility trades with simple spot hedges, shorting the asset that’s expected to underperform or buying the asset likely to outperform in a broader rally.
Amberdata’s Comparative Volatility Tools
Amberdata offers comparative charts that display real-time and historical term structures, skew profiles, and implied volatility surfaces for both BTC and ETH. By toggling between these charts or viewing them side by side, you can quickly see if anomalies appear in one asset’s volatility curve but not the other’s. These signals can initiate your relative value trading strategy or confirm suspicions that a volatility mismatch is, in fact, actionable.
Conclusion
In the race for market insight, a cross-asset perspective often reveals more than single-asset analysis can. By studying volatility surfaces for both BTC and ETH, traders unlock the potential for relative-value trades, leveraging discrepancies in implied volatility. Whether the goal is straightforward arbitrage, a carefully structured spread trade, or a balanced approach that hedges risk, cross-asset analysis is indispensable for anyone seeking an edge in today’s competitive crypto environment.
Amberdata’s charts, historical data, and real-time analytics make it possible to spot these mispricings early and build a strategy around them. From mean reversion setups that count on BTC and ETH returning to typical correlation levels, to opportunistic trades that capture fleeting arbitrage scenarios, the ability to compare volatility surfaces dynamically can elevate your decision-making.
Rather than treating BTC and ETH as isolated silos, consider them in tandem. Keep watch for divergences in skew, term structure, and how each asset’s implied volatility reacts to significant market developments. Over time, this disciplined practice of relative-value trading can pave the way for repeatable gains, smoother risk management, and a broader view of how crypto markets price uncertainty.
