Share this blog:

This quarter we’ve added a new section for Networks Overview. This is a quick comparison of four of the largest blockchains: Bitcoin, Ethereum, Bitcoin Cash, and Litecoin. Global regulatory progress provided clarity to digital assets, with Bitcoin ETFs now trading in several countries and new regulations like MiCA in Europe. Anticipation of spot Ethereum ETFs, expected in Q3, has divided analysts on their potential market impact. Memecoins initially drove Q2 volumes but overall market activity and excitement waned. New Layer 2 and Layer 3 blockchains launched, though users showed fatigue with activity incentive schemes.
Adding on to the Q1 2024 report, we’ve added another section to the Ethereum coverage:
- Liquid Staking & Restaking: Covering EigenLayer and liquid staking tokens, this section aims to provide an overview of the liquid staking provider supply growth and capital deployed on EigenLayer’s restaking platform.
Key Takeaways Q2 2024
Following a turbulent Q1 2024, which saw the initial wave of digital asset ETFs in the United States in the form of spot Bitcoin ETFs and ended with a continuous stream of memecoins, Q2 continued with more memecoins and ended with a whimper. Across the board, volume and activity began to decline and excitement waned. However, the narrative continues with some highlights:
- Progress in regulation around the world has brought clarity to digital assets in a large number of countries. Bitcoin ETFs are traded in Brazil, Australia, United States, and Canada. In Europe, the Markets in Crypto-Assets Regulation (MiCA) has gone live providing a much needed legal framework. Hong Kong’s crypto regulations, requiring licenses for platforms, have also gone live. These forward looking regulations may be in their infancy (or even toddler years), but the momentum has been building around the world for clarity and increasing maturity within the industry.
- Spot Ethereum (ETH) ETFs are expected to launch sometime this next quarter which has many analysts divided on the market impact. On the one hand, analysts expect strong demand and new inflows into the market potentially driving up prices on ETH, new interest in Ethereum (among other networks), and speculation on L2s or other digital asset ETFs (such as Solana). On the other hand, some analysts believe the new ETFs were priced in with the Bitcoin ETFs and that demand will be far less than Bitcoin ETFs were able to generate, in which case the currently suppressed prices are likely to continue. In any case, the arrival of spot ETH ETFs are an exciting development for the industry with Q3 2024 likely to be pivotal.
- Memecoins drove early Q2 2024 volumes with tokens like $TREMP and $BODEN bringing politically driven memes and $DWH (dogwifhat) and $JENSEN providing pop culture hits. (Disclaimer: we do not hold any of these tokens at the time of writing.) While memecoins have not proven any new facts, this cycle reiterated some of the well trodden themes of dog-coins, politics, and celebrities as well as well trodden influencer driven dump-and-dumps.
- New Layer 2 (and Layer 3) blockchains and protocols have launched, including networks like Blast and OKX’s “X-Layer”, providing users with more options for their financial needs. Many protocols have been criticized for their activity incentive schemes using tactics like “point” systems to facilitate potential airdrop farming, despite a lack of clarity in terms of token distribution or point values. Users are appearing to have “point” fatigue which is likely to force new protocols or networks to re-think their user acquisition strategies.
Recap - Q2 2024 at a Glance
Token Prices Ended in a Whimper
The second quarter of 2024, hot off the heels of a big bang in the industry triggered by Bitcoin spot ETF approvals in the United States and followed around the world, ended in a whimper.
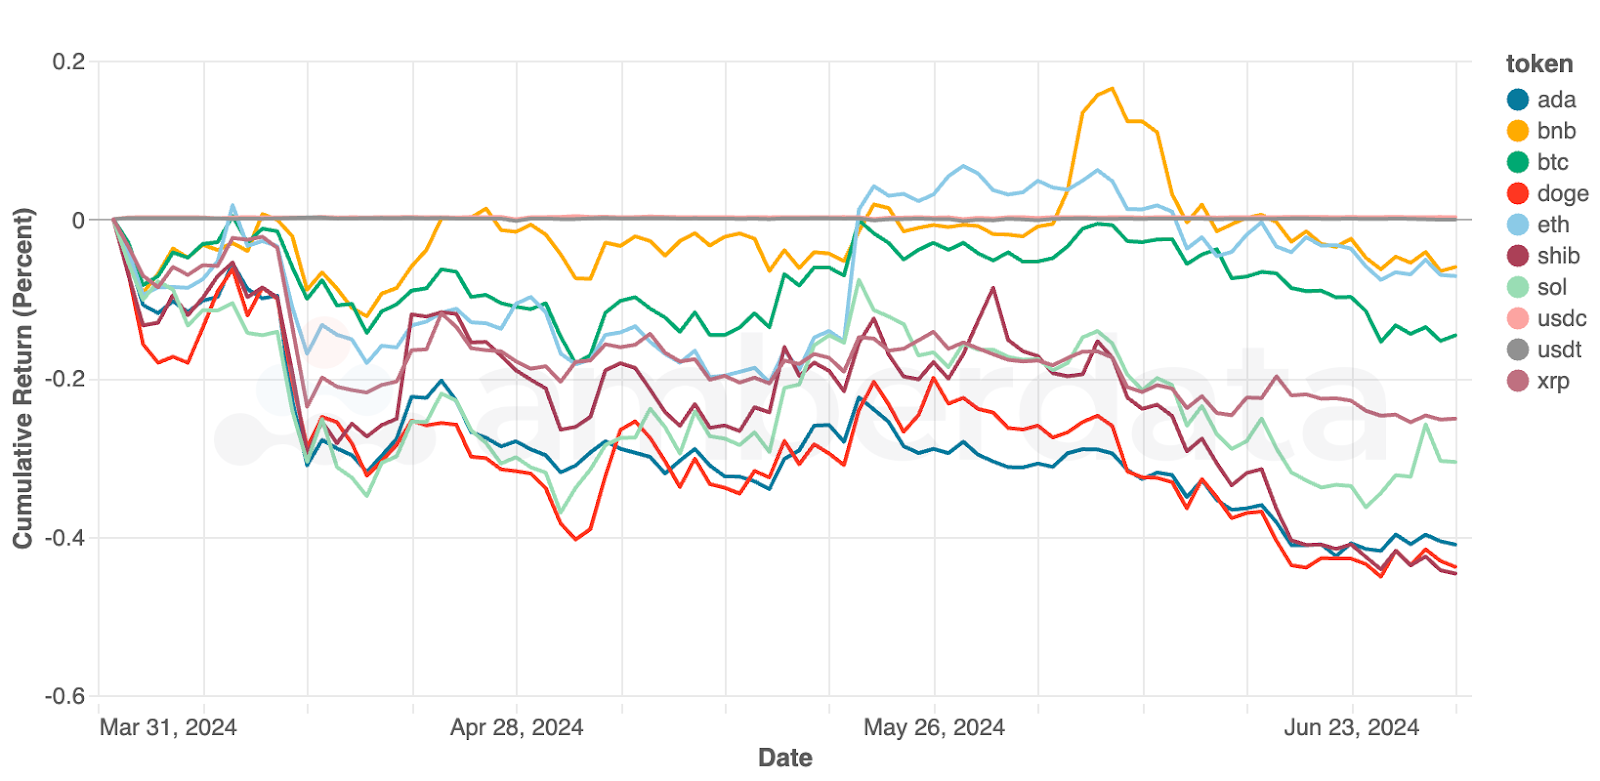
Token price changes over Q4 2023
Token prices generally underperformed, with BTC ending the quarter just over $63,000 having started the quarter at $70,000. Despite the bullish sentiment on ETH, with ETH ETF applications moving forward in the United States, the token ended down over 5% by the end of the quarter. The biggest collapses in token prices were DOGE and SHIB – who could not find their footing during the mini memecoin rallies – and ADA (Cardano) – which has been struggling for user acquisition for some time now.
Since the end of the quarter, downward pressure from Mt. Gox token distributions and German asset seizure sell-offs (in the magnitude of billions of dollars) have continued to suppress token prices. The main question for the coming quarter is whether these sell-offs are great buying opportunities for dollar-cost averaging or if the added supply to the market finds more sellers than buyers.
Market Capitalization Mostly Declined
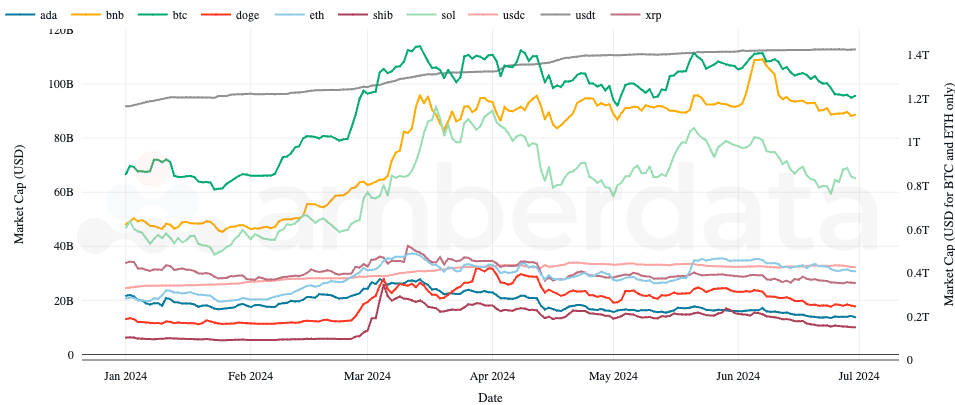
Market capitalization over Q4 2023 with BTC and ETH on the right axis for visual improvement
Market Capitalization across tokens mostly declined over the course of Q2 2024, having reached year highs in March (with the exception of USDT and BNB. USDT as we’ll see later in this report), has grown in supply all year. BNB, meanwhile, had a massive price spike in June 2024 and has since given up token price gains while holding steady its growing token supply.
Networks Overview
With the quarter shedding some of the previous price gains, blockchain developers have continued to beat the drum: bear markets are for building.
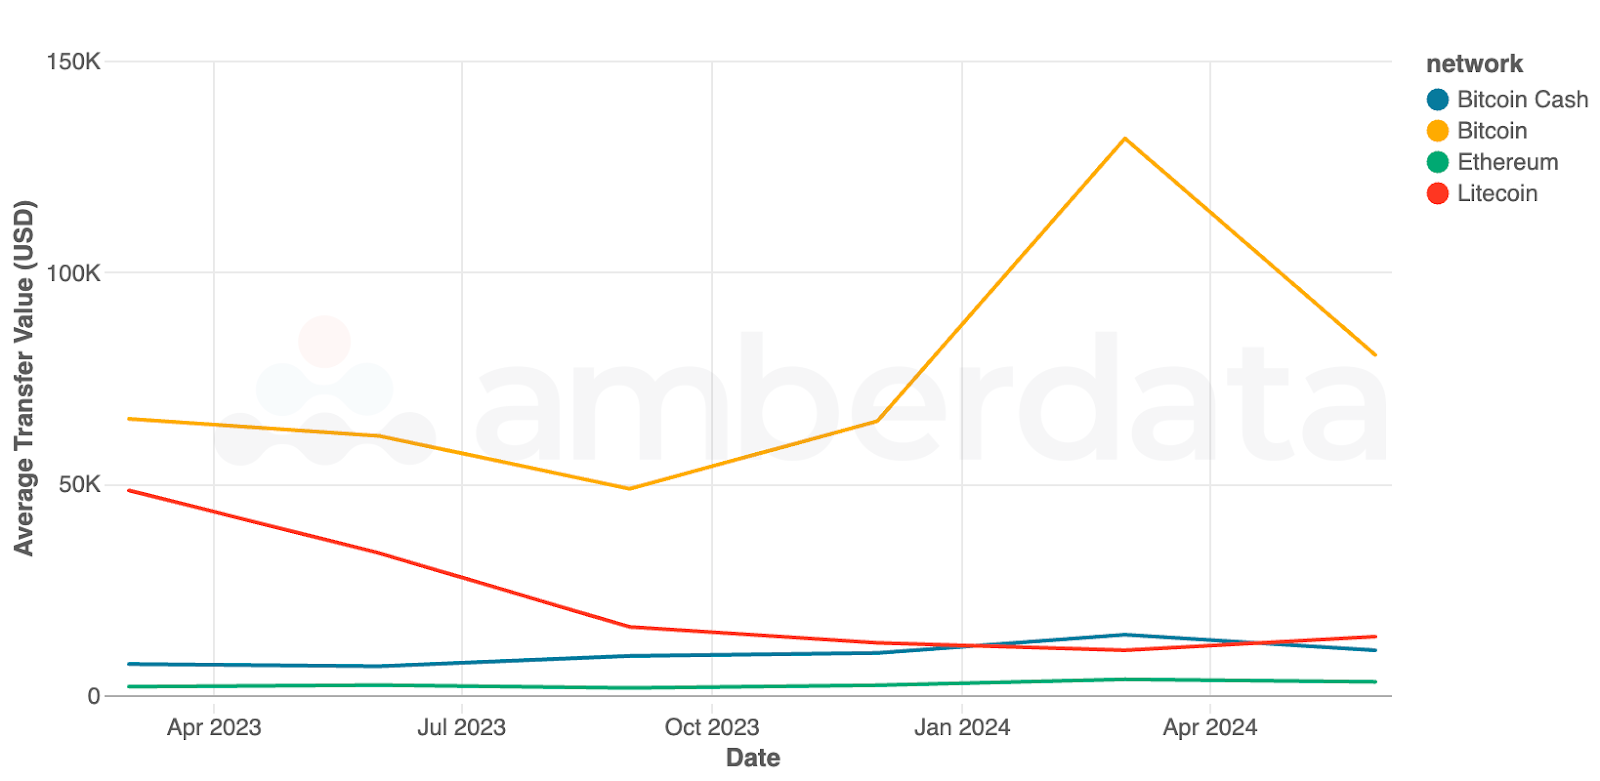
Average transfer value (in USD) since January 2023
Bitcoin’s mainstream moment in Q1 2024 brought huge shifts in transfer values as several ETF providers and centralized exchanges reshuffled their positions (for example, a massive transfer of holdings from Grayscale to other ETF providers). The following quarter saw a general settling as transfer values returned to their 2023 levels. It’s yet to be seen whether network usage will expand as traditional finance onboards into the digital asset space, or if they prefer to remain abstracted and rely on centralized exchange counterparts.
Meanwhile, Ethereum and Litecoin saw a period of growth in average transfer values despite the underlying token prices decreasing over the time period.
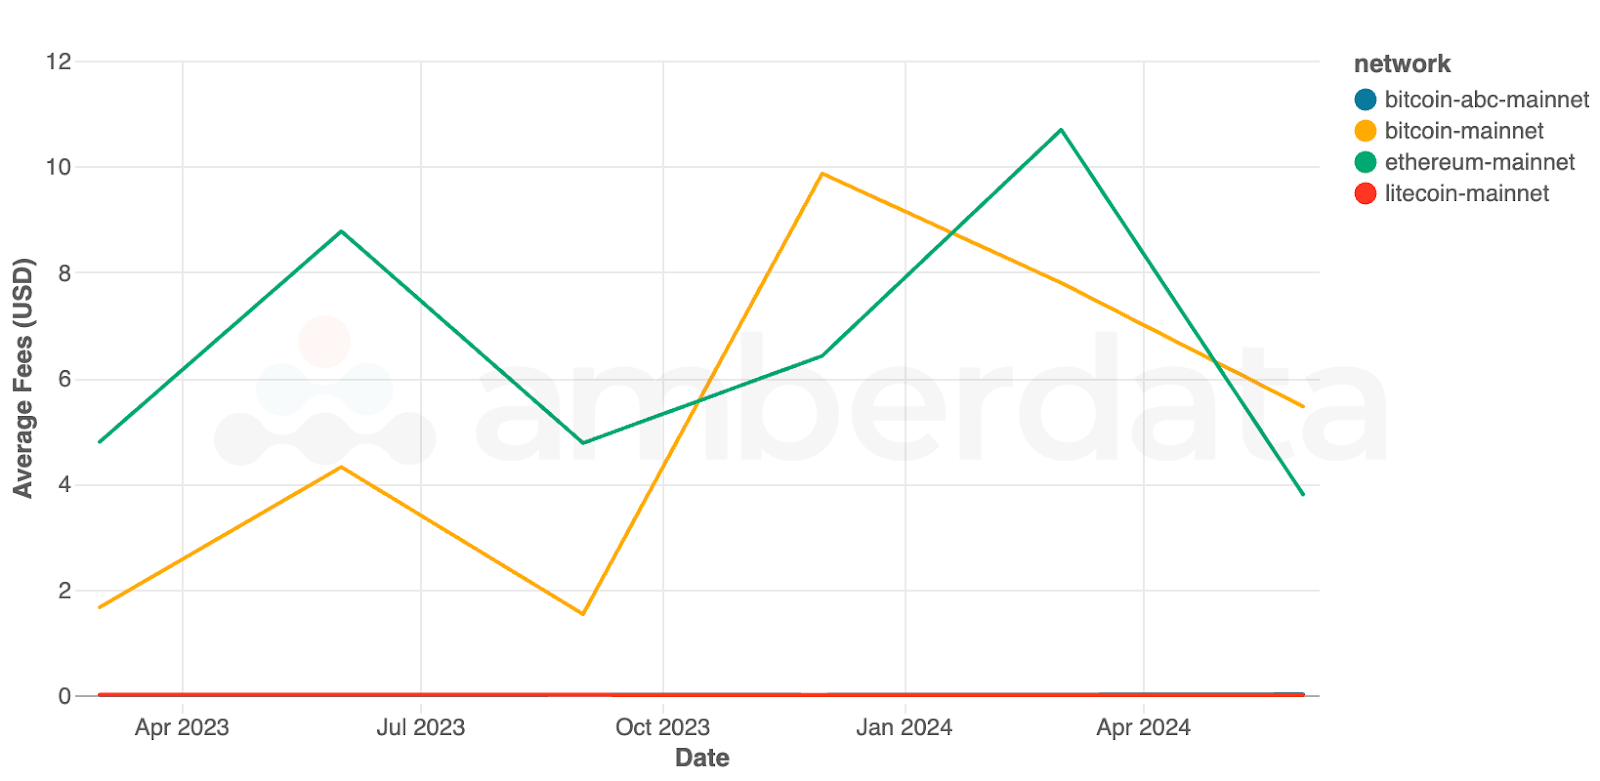
Average fees on blockchain networks since January 2023
Average fees declined sharply across every network. Notably, Ethereum’s average fees have dropped significantly since Q1, and have even fallen below January 2023 levels. The network has been steadily focusing on fee reduction and the introduction of blobs appears to play a role. Blobs are temporary memory space designed mainly for L2s to leverage, offloading much of the memory requirements, holding back blockspace and reducing the overall fees required for transactions on the L1 and L2s.
Similarly, Bitcoin’s hype in Q4 2024 (in anticipation of spot ETF approvals) and the wave of ordinals pushing the network to new limits, has reduced fees significantly. Average fees on the network are down significantly from previous quarters, giving network users some relief. As network activity decreases, average fees tend to follow suit.
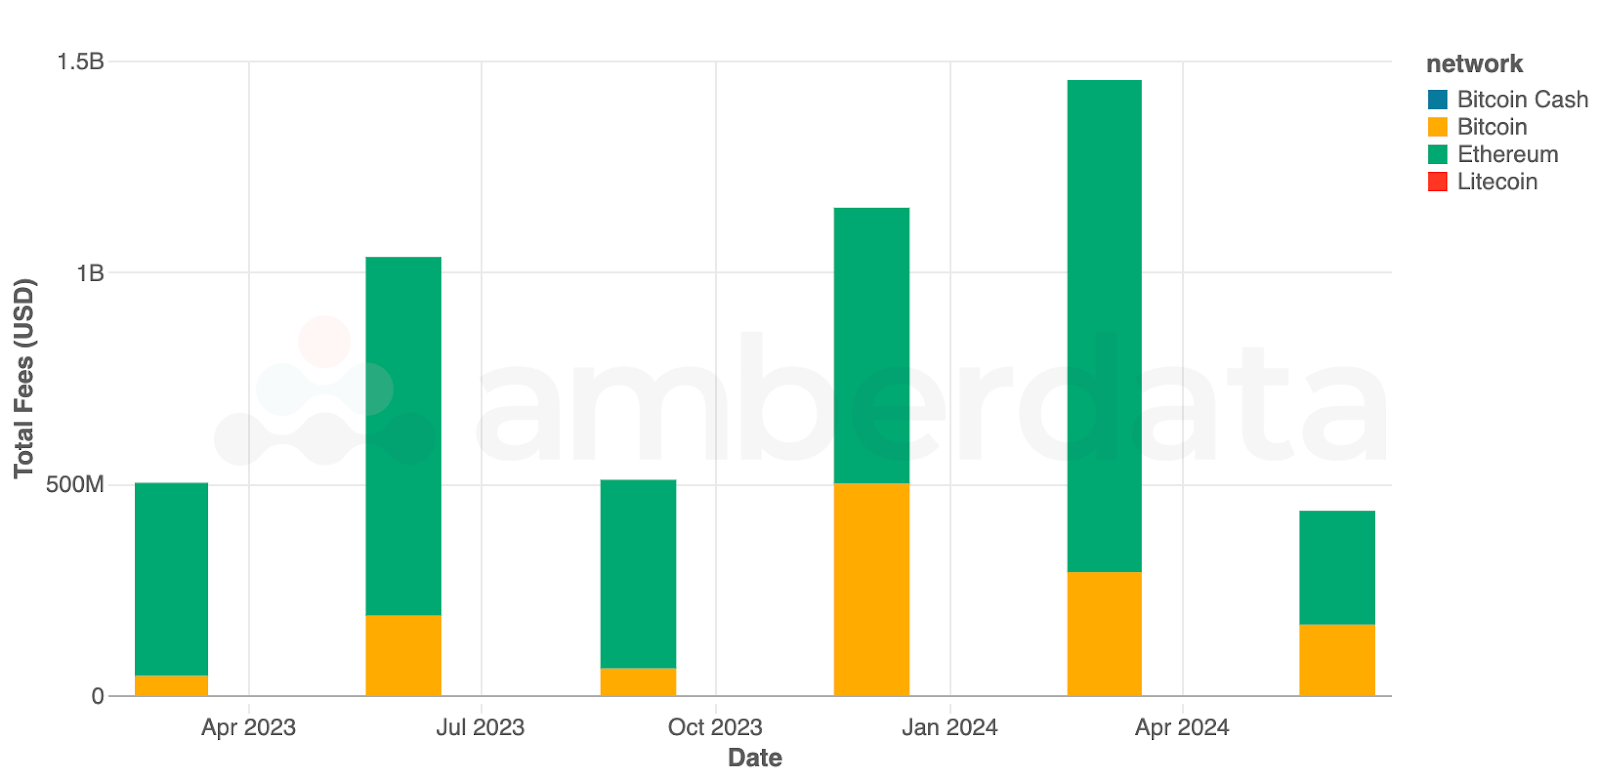
Total fees collected by blockchain networks since January 2023
Total fees collected – as expected – followed the downward trend across both Ethereum and Bitcoin in the previous quarters. Combined with price declines for both BTC and ETH, the decrease in fees has led to a large decrease in the USD value of fees across networks.
Bitcoin
Spot Trading Withered
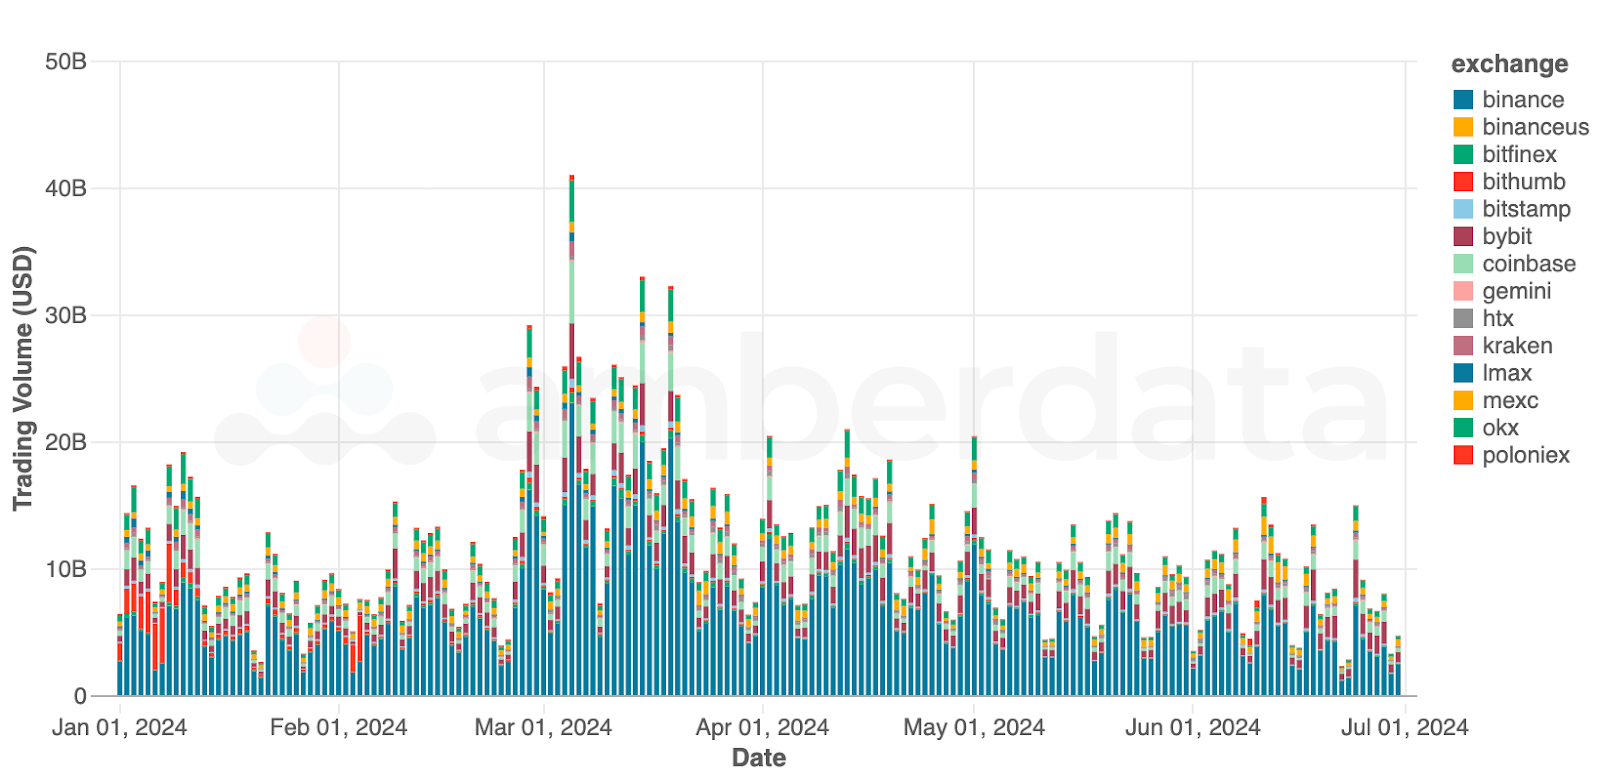
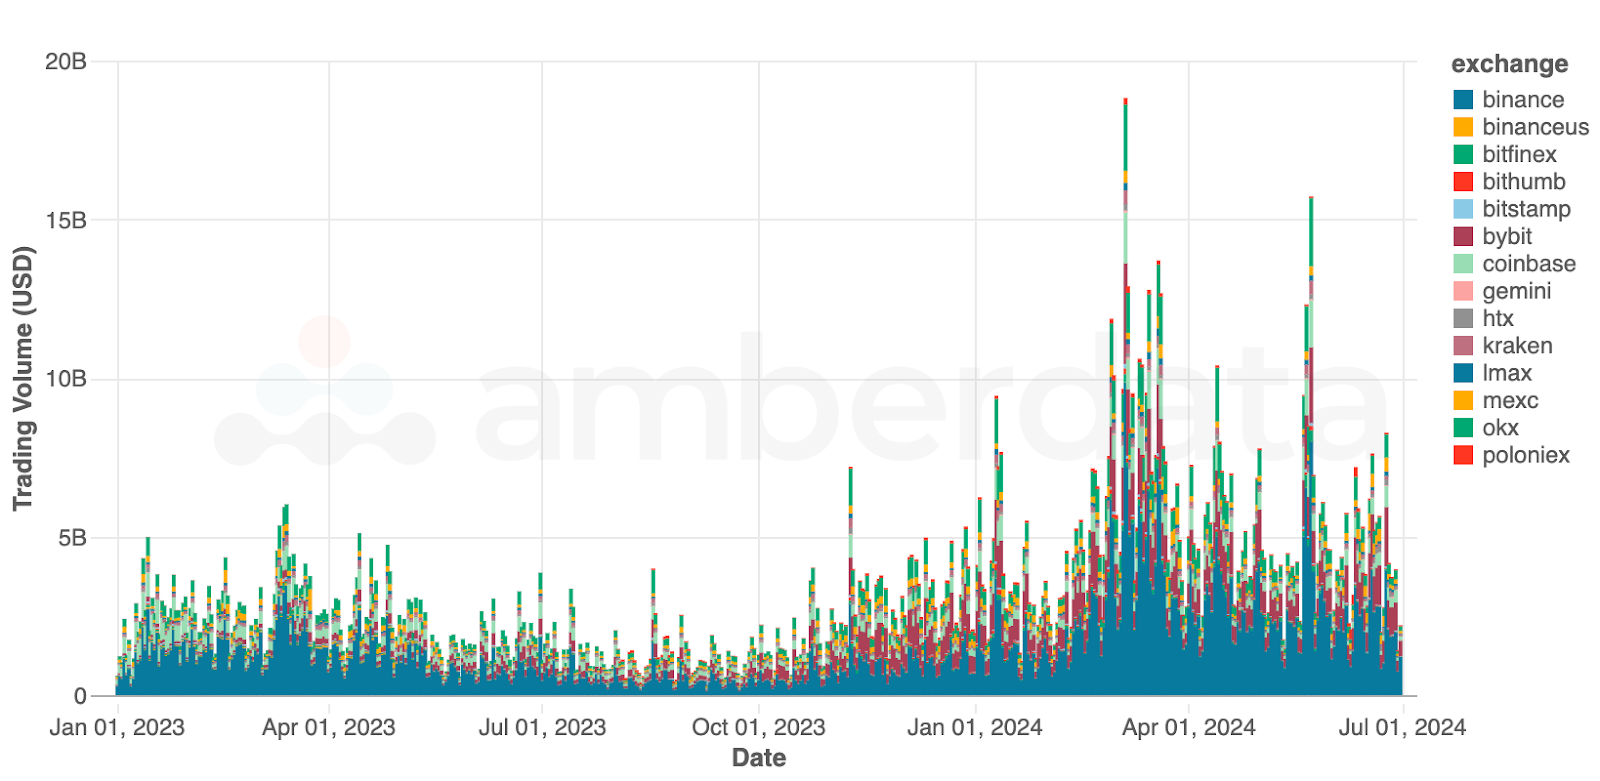
Centralized exchange spot BTC trading volumes (in USD) since January 2024
Bitcoin spot trading blossomed during Q1 2024 and withered in Q2. Daily trading volume through the quarter peaked around $20 billion, but averaged around $10 billion. Despite peak trading far from previous quarters, Q2’s average daily trading volumes were generally higher than early Q1 which saw around $7 billion daily.
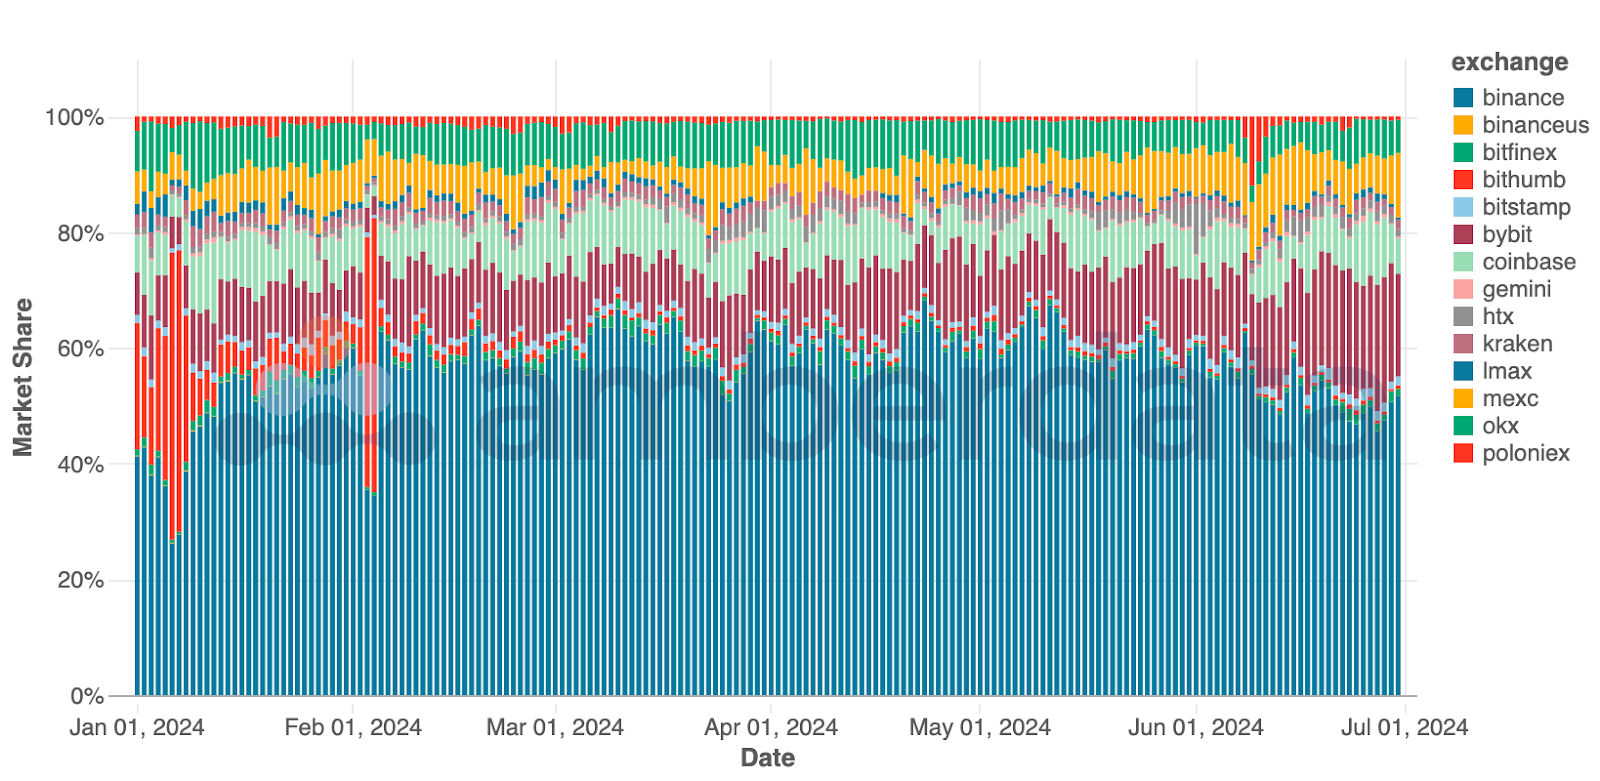
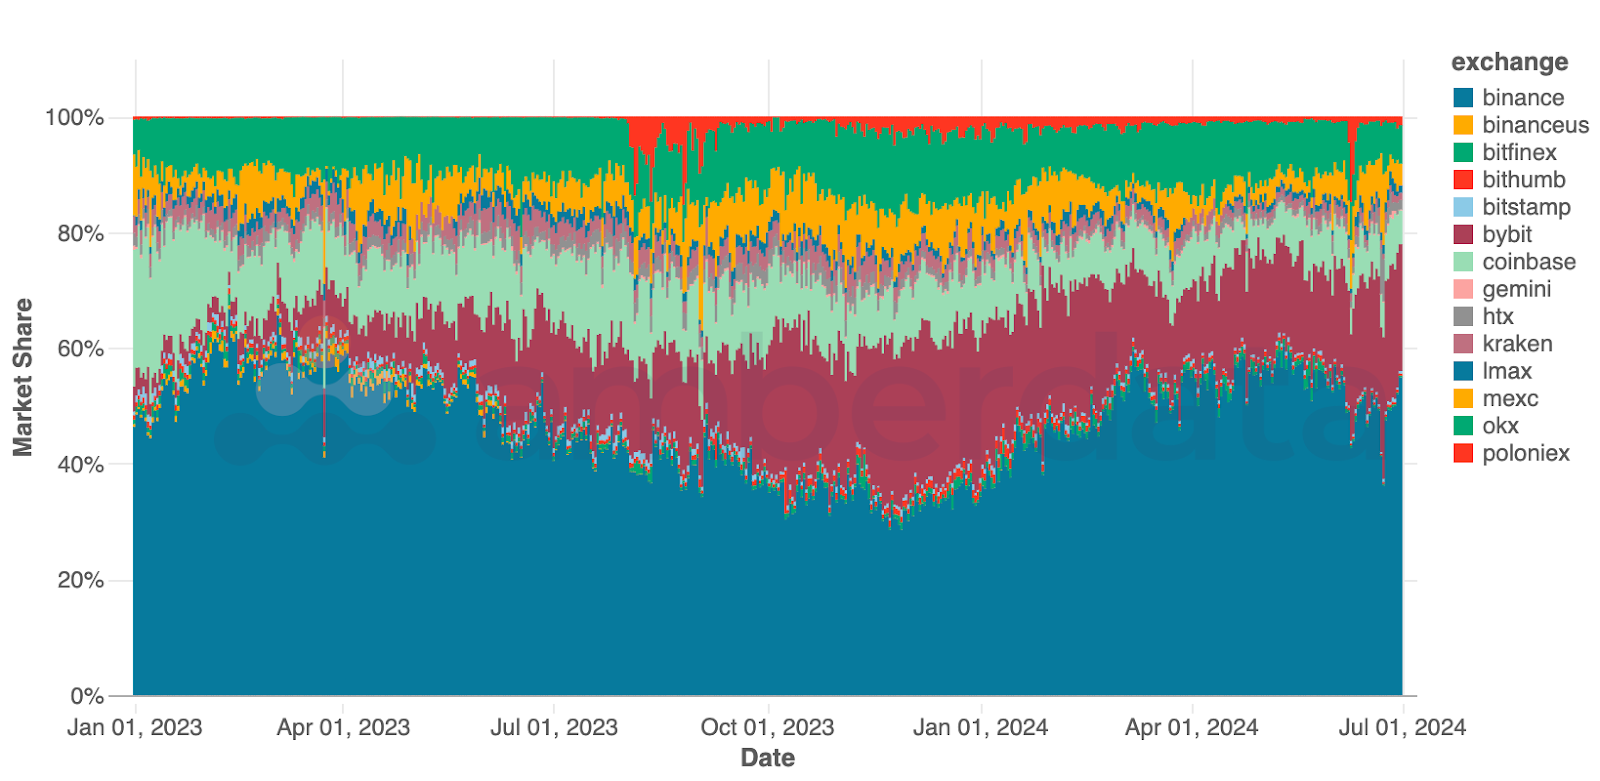
Centralized exchange spot BTC trading volume market share since January 2024
No surprise that Binance continued to dominate BTC trading volume – the exchange holds over 50% of global centralized exchange spot volume. A notable shift occurring in Q2 was the positive growth from Bybit and MEXC, capturing some of Binance’s dominant market share. Coinbase volumes haven’t shifted too much, despite being the custodian of several ETF issuers, and OKX remains a formidable exchange.
Price Indicators Show Downward Shift
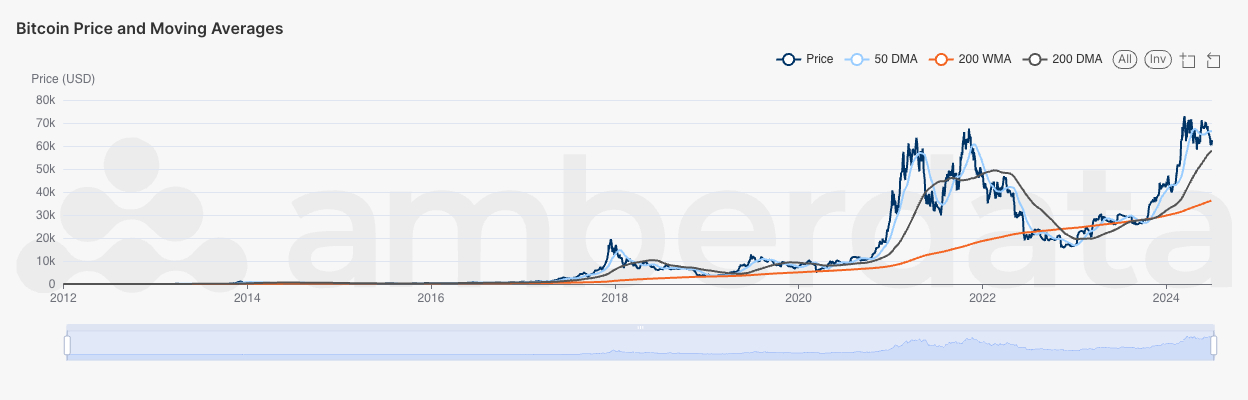
Bitcoin price and moving average comparisons (50-day moving average, 200-week moving average, and 200-day moving average)
Bitcoin’s price ended Q2 just above the 200-day moving average, though price activity post quarter close has led to the price crossing this indicator. Prices are still some ways from the 200-week moving average, considered by some to be a bottom indicator.
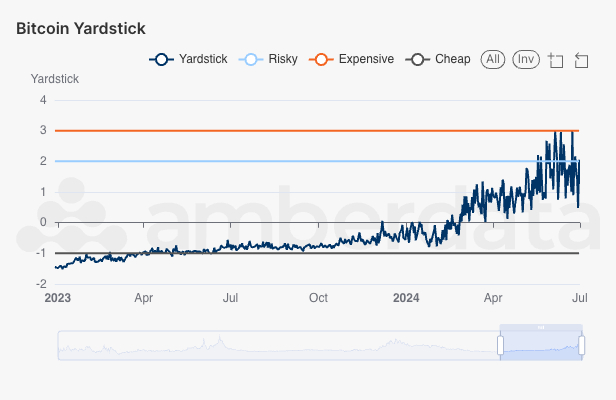
Bitcoin Yardstick since January 2023
The Bitcoin Yardstick, the perceived value of the network (market cap) over the value of energy used to maintain it (hash rate), shows the price of BTC to be at the “Risky” level. Q2 Price activity, along with the decline in network activity, have pushed prices further towards high risk profiles than in Q1.
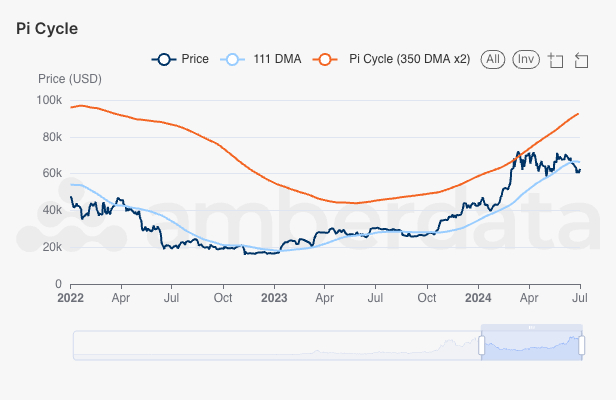
Bitcoin Pi Cycle since January 2022
The Bitcoin Pi Cycle consists of the 111-day moving average (111DMA) and a 2x multiple of the 350-day moving average (350DMA x2). While the two indicators have not crossed to signal a change in the market cycle, the bands have narrowed significantly since previous years. The Pi Cycle and 111-day moving average appears to be widening in the last few weeks which is often a sign of shifting market swings.
Network Metrics Show Transaction Levels at New Highs
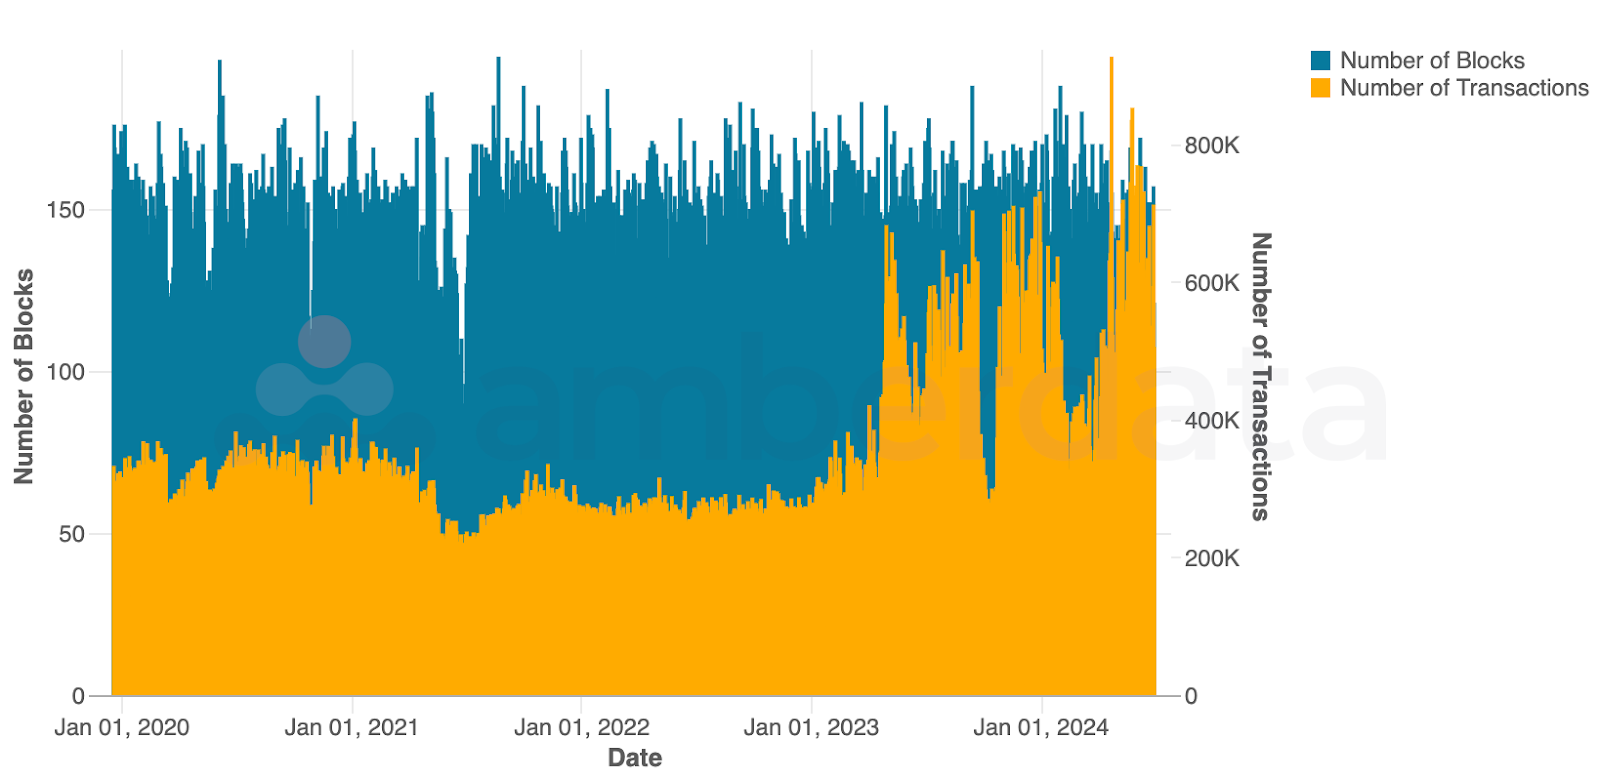
Bitcoin block and transaction counts since January 2020
As previously mentioned, Bitcoin blockspace has been more congested since the spot ETF approvals. However, as we have mentioned in our previous quarterly reports, Bitcoin Ordinals have significantly increased network activity starting around mid-2023. The combined increased network congestion from Ordinals, and the increased network usage from traditional finance entering the digital assets space, have pushed transactions to new highs.
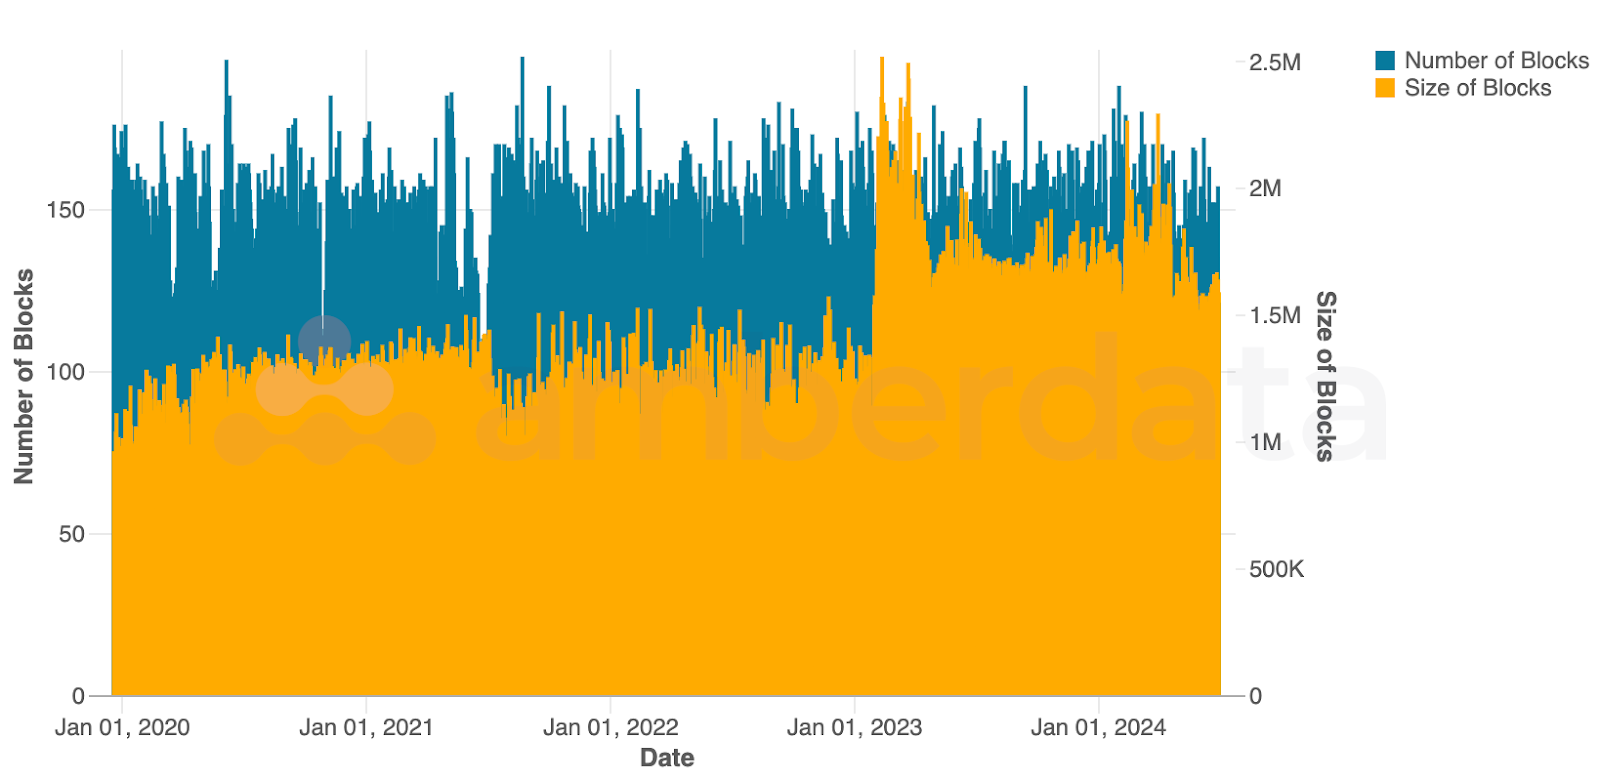
Bitcoin block counts and size since January 2020
Block size has also increased, which has led to higher average transaction fees as larger blocks have more data requirements and are therefore more expensive to transact. Block size has been decreasing somewhat over the last quarter, but still remains higher than 2020 levels. Expectations are that this will continue into the near future as adoption grows - as long as scaling solutions remain at bay.
ETFs - Blackrock and Fidelity are Winners
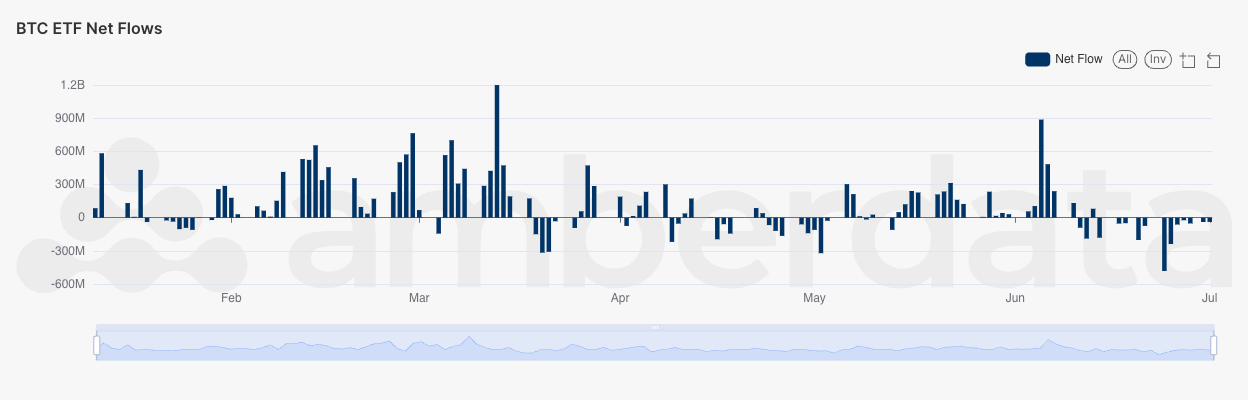
Net flows into (or out of) BTC ETFs
Net flows for Bitcoin ETFs have cooled in Q2 with almost the same number of days with net outflows as the number of days with net inflows. June saw far more days of net outflow, signaling some weakness in the market as BTC prices declined over the month.
Bitcoin block and transaction counts since January 2020
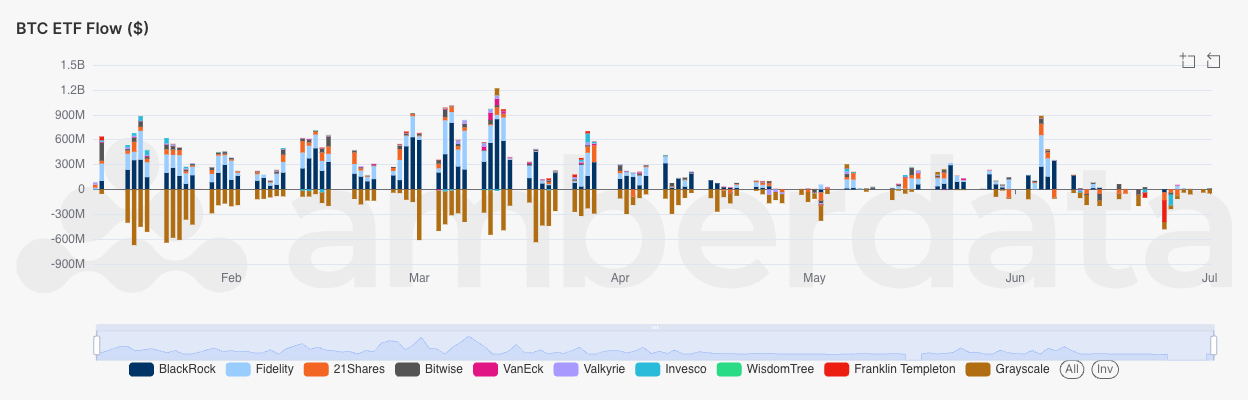
Interestingly though, over the course of Q2, Blackrock and Fidelity were key beneficiaries having seen several large positive inflows in April, May, and June. Given that no issuers saw equivalent net outflows during these days, it’s safe to say that these positive inflows are new funds entering the market. Meanwhile, Franklin Templeton and Grayscale were net sinks, having far more net outflow days and volume than any other issuers.
Ethereum
Spot Trading is Keeping Pace
Centralized exchange spot ETH trading volumes (in USD) since January 2024
Spot trading volumes for ETH have generally kept pace with the prior quarter. Unlike BTC, whose ETF approval came quickly, ETH’s ETF approval process is full of anticipation and rumor. Many expected the ETF to be approved immediately after BTC – which of course did not happen. However, the memecoin craze, which occurred mostly on Base and Solana, brought waves of ETH trading in March and May in line with the news of the ETH ETF progression.
Centralized exchange spot ETH trading volume market share since January 2024
Despite Binance’s dominance of BTC trading volume market share, the Asia-rooted exchange captures only around 50% of daily trading volume. Bybit and Bitfinex are larger players in this space, while Coinbase has seen a massive decrease in trading volume since 2023.
Price Indicators Hint at Challenges Ahead
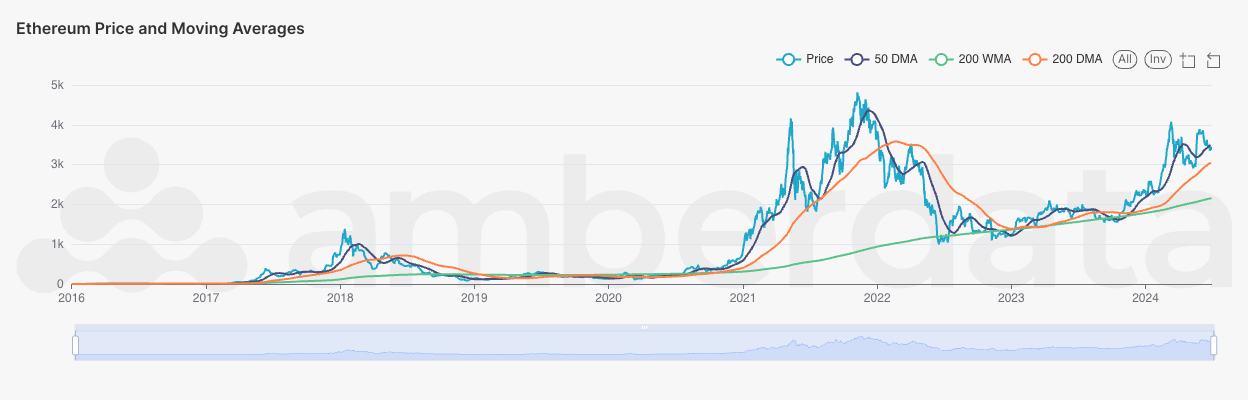
ETH price and moving average comparisons (50-day moving average, 200-week moving average, and 200-day moving average)
Ethereum’s price throughout 2024 has been one of resurgence, climbing out of the bear market and pushing towards all time highs. However, Q2 saw prices weakening despite the narrative of both the market activity and institutional funds entering the market. As the quarter ended, with fears of Mt. Gox token distributions leading to a wider market sell-off and Germany token seizures being sold off, ETH prices will have a challenge ahead. ETH must prove its staying power for traditional financial markets who are not as convinced with the network’s ability to be a store of value vs. BTC.
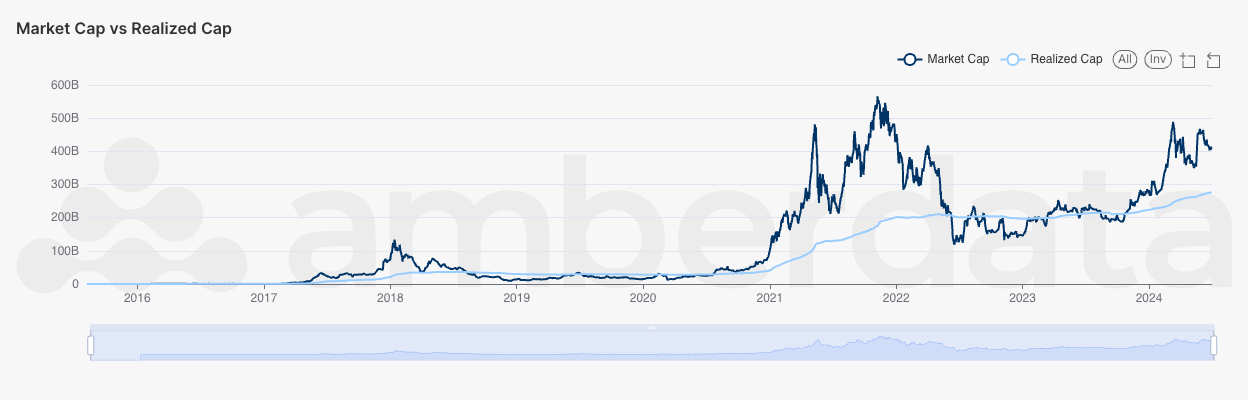
ETH market cap to realized cap
ETH Realized Cap has steadily been growing since 2023, and Q2 2024 continued the trend despite the overall price decline. Realized Cap is the total realized value of ETH as a function of supply and the last moved price. Realized Cap is the aggregation of all realized token value, with an increasing number indicating that more tokens have moved while prices were higher than they were previously.
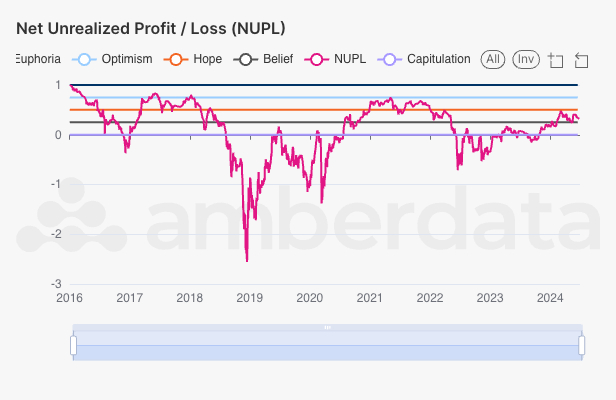
ETH net unrealized profit / loss
The ETH net unrealized profit/loss has stayed within the bands of “Belief” and “Hope” throughout 2024. This indicator is more of a market sentiment of price performance than a price predictor, with the current price range indicating that the market has Belief in the token. Compared with BTC, ETH market sentiment remains slightly lower.
Network Metrics Show Supply Growth
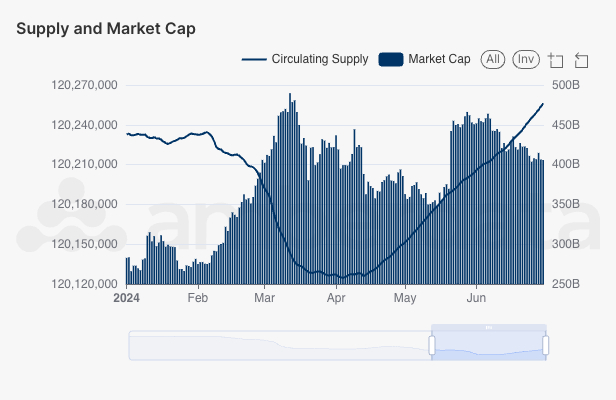
ETH supply and market cap since Jan 2024
ETH market cap has fluctuated quite a bit over the past quarter, having gone from $350 billion to over $450 billion and steadily returning back. Supply has likewise started its slow march forwards having been on a slow decline since the merge shifting the network from Proof-of-Work to Proof-of-Stake. The growth in supply is both a factor of network usage shifting toward L2s and an overall reduction in fees.
ETH supply and market cap since Jan 2024
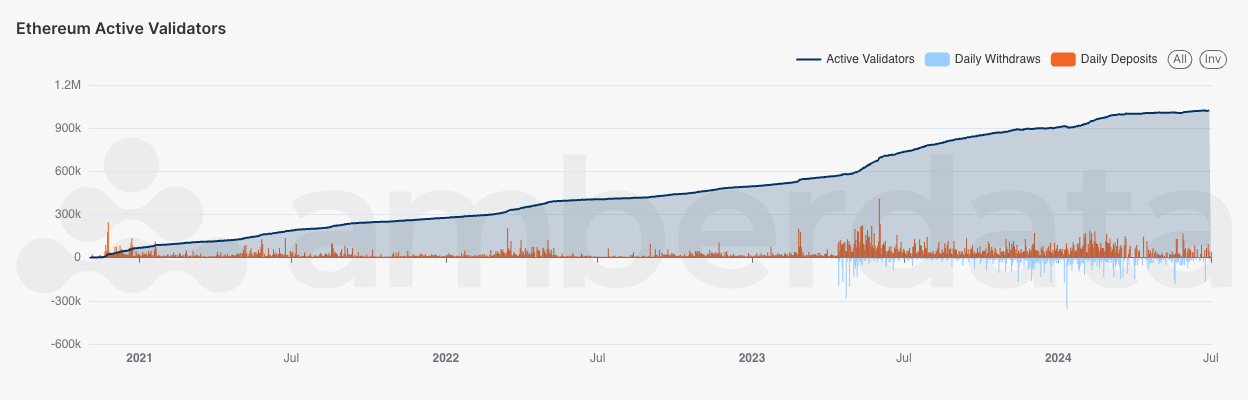
Growing supply is good news for validators, who have been continuing to grow in volume and count. Despite most analyst’s belief that the merge would lead to increased withdrawals as validators were able to begin removing their deposits, the cap on validator withdrawals has yet to be hit. In fact, the opposite has occurred in practice: there are now more validators than ever before and continued deposits.
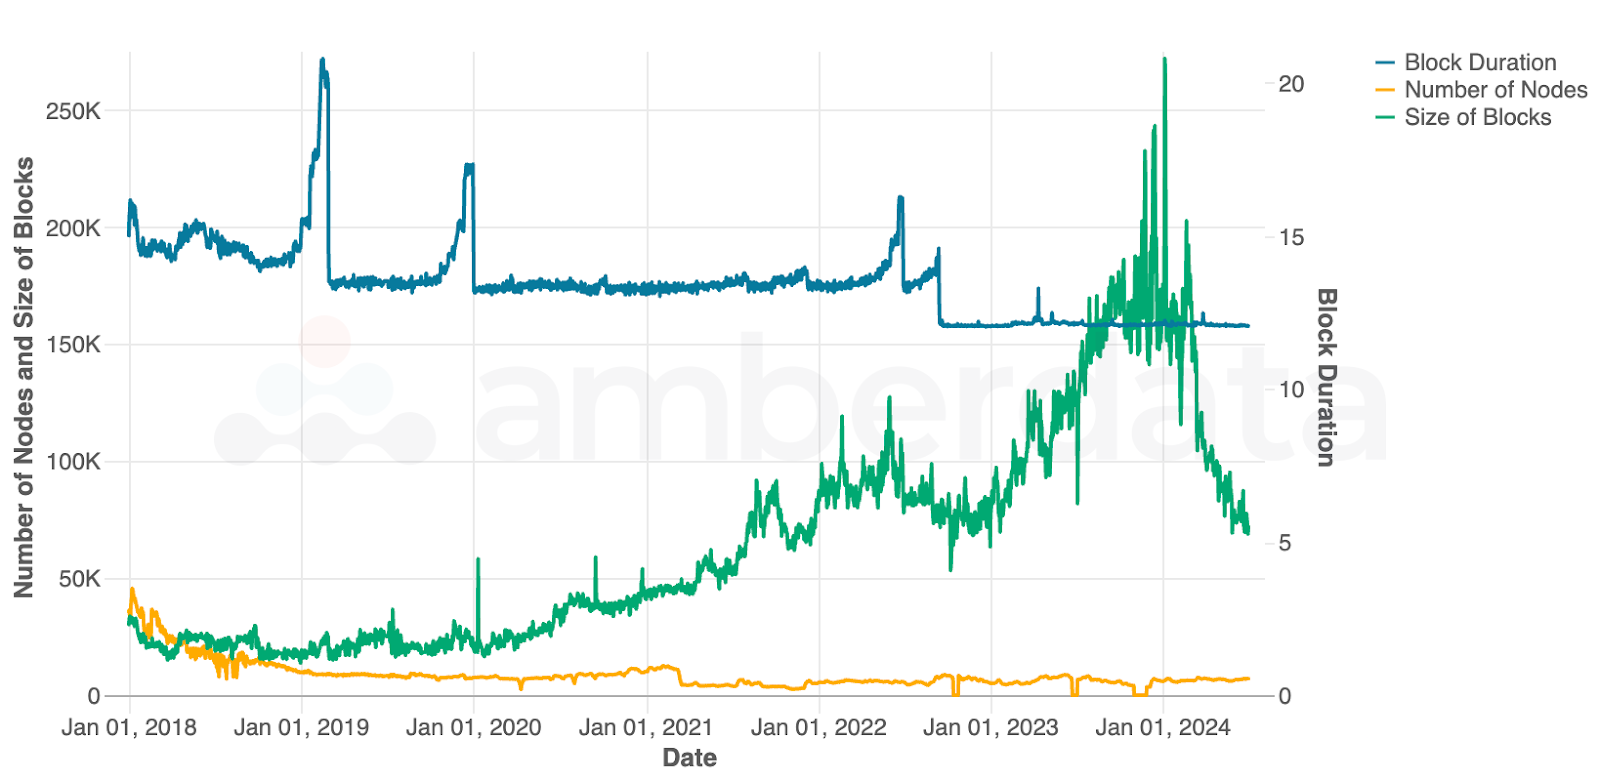
Ethereum network metrics (block duration, number of nodes, and block size) since Jan 2018
The Ethereum network has undergone many changes over the last few years, though each incremental change may be difficult to see in the short term. Over a longer period of time, we can see a significant drop in block duration as the network is moving fast and getting faster. In addition, the block size has been growing quickly, mostly due to increased network activity and more data being used in each block. Blobs are proving that much of that data can be reduced, leading to smaller block sizes (returning to 2022 levels) and likely continuing to drop over time as blob adoption and L2 usage increases.
Liquid Staking & Restaking - Lido in the Lead
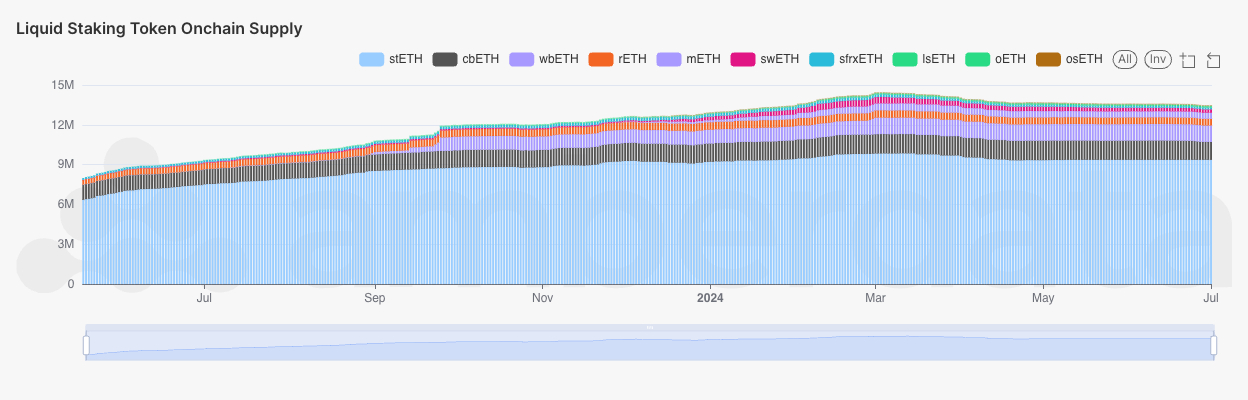
Liquid staking tokens’ supply since May 2023
Liquid staking tokens (LSTs) have grown to become a major part of the Ethereum ecosystem, similar to stablecoins. LSTs represent ETH staked on a staking platform, with stETH being ETH staked on Lido and cbETH being ETH staked on Coinbase. Lido remains the largest LST provider with over 9 million stETH issued to date. The LST market has slightly declined in Q2, having peaked in March following the price of ETH declining. It appears that some of the liquid staked ETH has been removed and sold as part of this price decline.
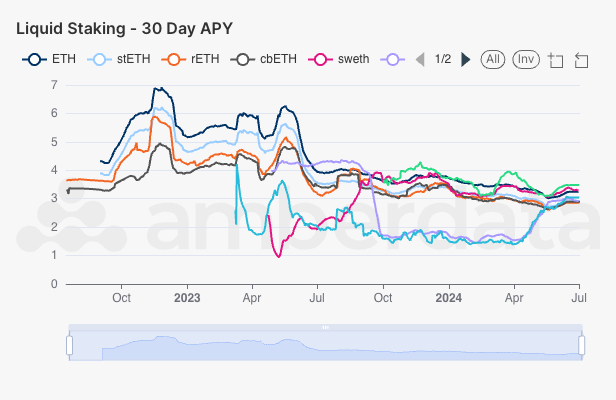
Liquid staking tokens’ 30-day APYs
LST APYs, shown here as 30-day APYs, are all normalizing to the same range which is around 3%. It appears that competition around LSTs is forcing providers to raise APYs to remain competitive, while LSTs with higher APYs have been dropping yields to holders to better reflect the market conditions.
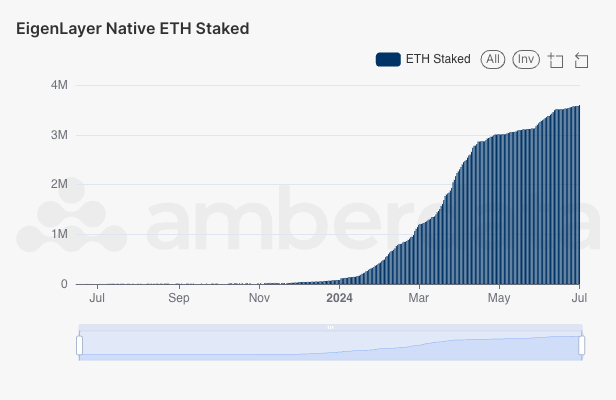
EigenLayer native ETH staked on AmberLens
Native ETH staked on EigenLayer has grown extremely quickly since the platform launched in early 2024, having over 3.5 million ETH staked. The staking platform, which aims to provide protocols with additional security while returning additional yields to users, has had a huge wave of interest prior to its launch despite the numerous concerns of concentration risk and honey pots.
While Ethereum has previously been one of the most decentralized networks, EigenLayer having a significant stake of native ETH (as well as other liquid staking protocols) brings a large concentrated share of stake. In addition to the risks presented to the Proof-of-Stake networks, where a large concentration of tokens are held by a single entity, risks are also presented where an exploit could see much of these tokens moved to an exploiter and sold. This would lead to huge downward pressure in price (and huge increase in liquid supply), as well as a massive number of other impacts (such as liquidations).
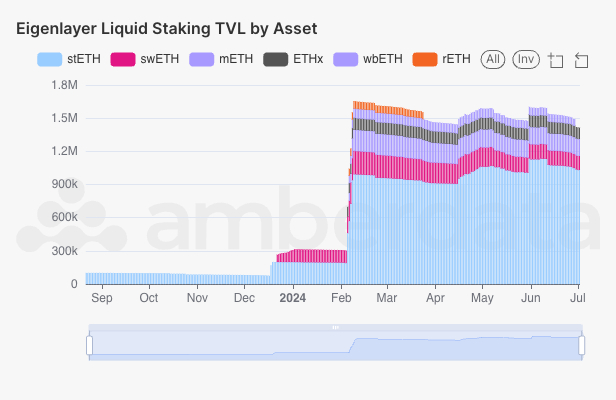
EigenLayer liquid staking TVL by asset
For liquid staking tokens, stETH (staked ETH) makes up the lion's share of the tokens locked on EigenLayer, representing over $900,000 of stETH. Following stETH, swETH (Swell staked ETH) represents the second largest share of LSTs with almost $250 million of swETH of its $500 million market cap.
Download the full report here as this is just the subset of the report which also includes Stablecoins - Ethereum Supply, Spot Trading, DEX Trading, DeFi Lending, Real World Assets (RWAs), CEX Spot Trading, Decentralized Exchanges, DeFi Borrow/Lending, and much more!
