Share this blog:
Customer requests for Amberdata.io features have been flooding in, we’ve been #BUILDing and shipping as fast as our team can code. These updates are very exciting, as they unleash so many new & actionable business cases.
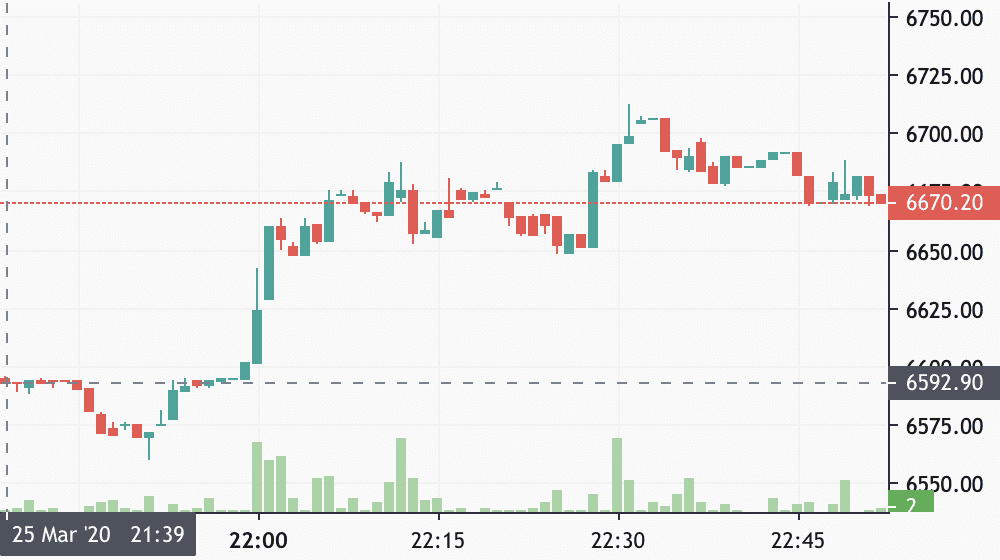
Realtime OHLCV for Bitcoin via Amberdata.io API
New Metrics!
Actionable metrics are hard to come by, most require going to a website or waiting for the daily/weekly roundup. Our latest endpoints focus on time series realtime and historical data. While we default to a 24hr time frame, we actually offer a large amount of options for time frame & tick intervals with options: 1 minute, 5 minute, 1 hour, 1 day, 1 week. Data sets include historical data going back to each blockchain genesis.
Blockchain Metrics
Context is key — We now provide two endpoints that have blockchain level context metrics:
- Blockchain Metrics Latest — Realtime network status data, including metadata
- Blockchain Market Data — Ranking, price, supply & more
Blocks
Diving deeper into a blockchain, we can look at block data over time. This reveals how the network is operating & including transactions. Metrics returned in these endpoints include: timestamp, difficultyAverage, durationAverage, hashrateAverage, issuanceAverage, issuanceTotal, issuanceUnit, sizeAverage, transactionsAverage, transactionsTotal
- Block Metrics Latest — A rolling window of realtime data over a time frame
- Block Metrics Historical — Time series data including the above metrics
Transactions
Lastly, we have transactions metrics, the key way to look at value and fees moving in the network. Metrics available in these endpoints include: timestamp, feesAverage, feesAverageUSD, feesTotal, feesTotalUSD, feesUnit, transactionsTotal, valueAverage, valueAverageUSD, valueTotal, valueTotalUSD, valueUnit
- Transaction Metrics Latest — A rolling window of realtime transaction data
- Transaction Metrics Historical — Time series data including the above metrics
Options & Configurations
The following are outlined within our documentation, however I wanted to highlight the use & available options for easy understanding. Using these 3 parameters allows your application to get the specific data you need.
- timeFrame — tick intervals, default 1h, with options: 1m, 5m, 1h, 1d, 1w
- startDate — Defines the beginning of the data time frame
- endDate — Defines the ending of the data time frame
Developer Challenge: Scale DeFi Update
We’re coming to an end with the developer challenge. We’ve already paid 4 great projects and can’t wait to share the full scope of exciting projects once they’re done! There’s still time to build — start now:

BUILD & Earn today! See here →
CSV Support
Tired of JSON? Who’s JSON?
Why do you only deliver JSON when I want CSV!
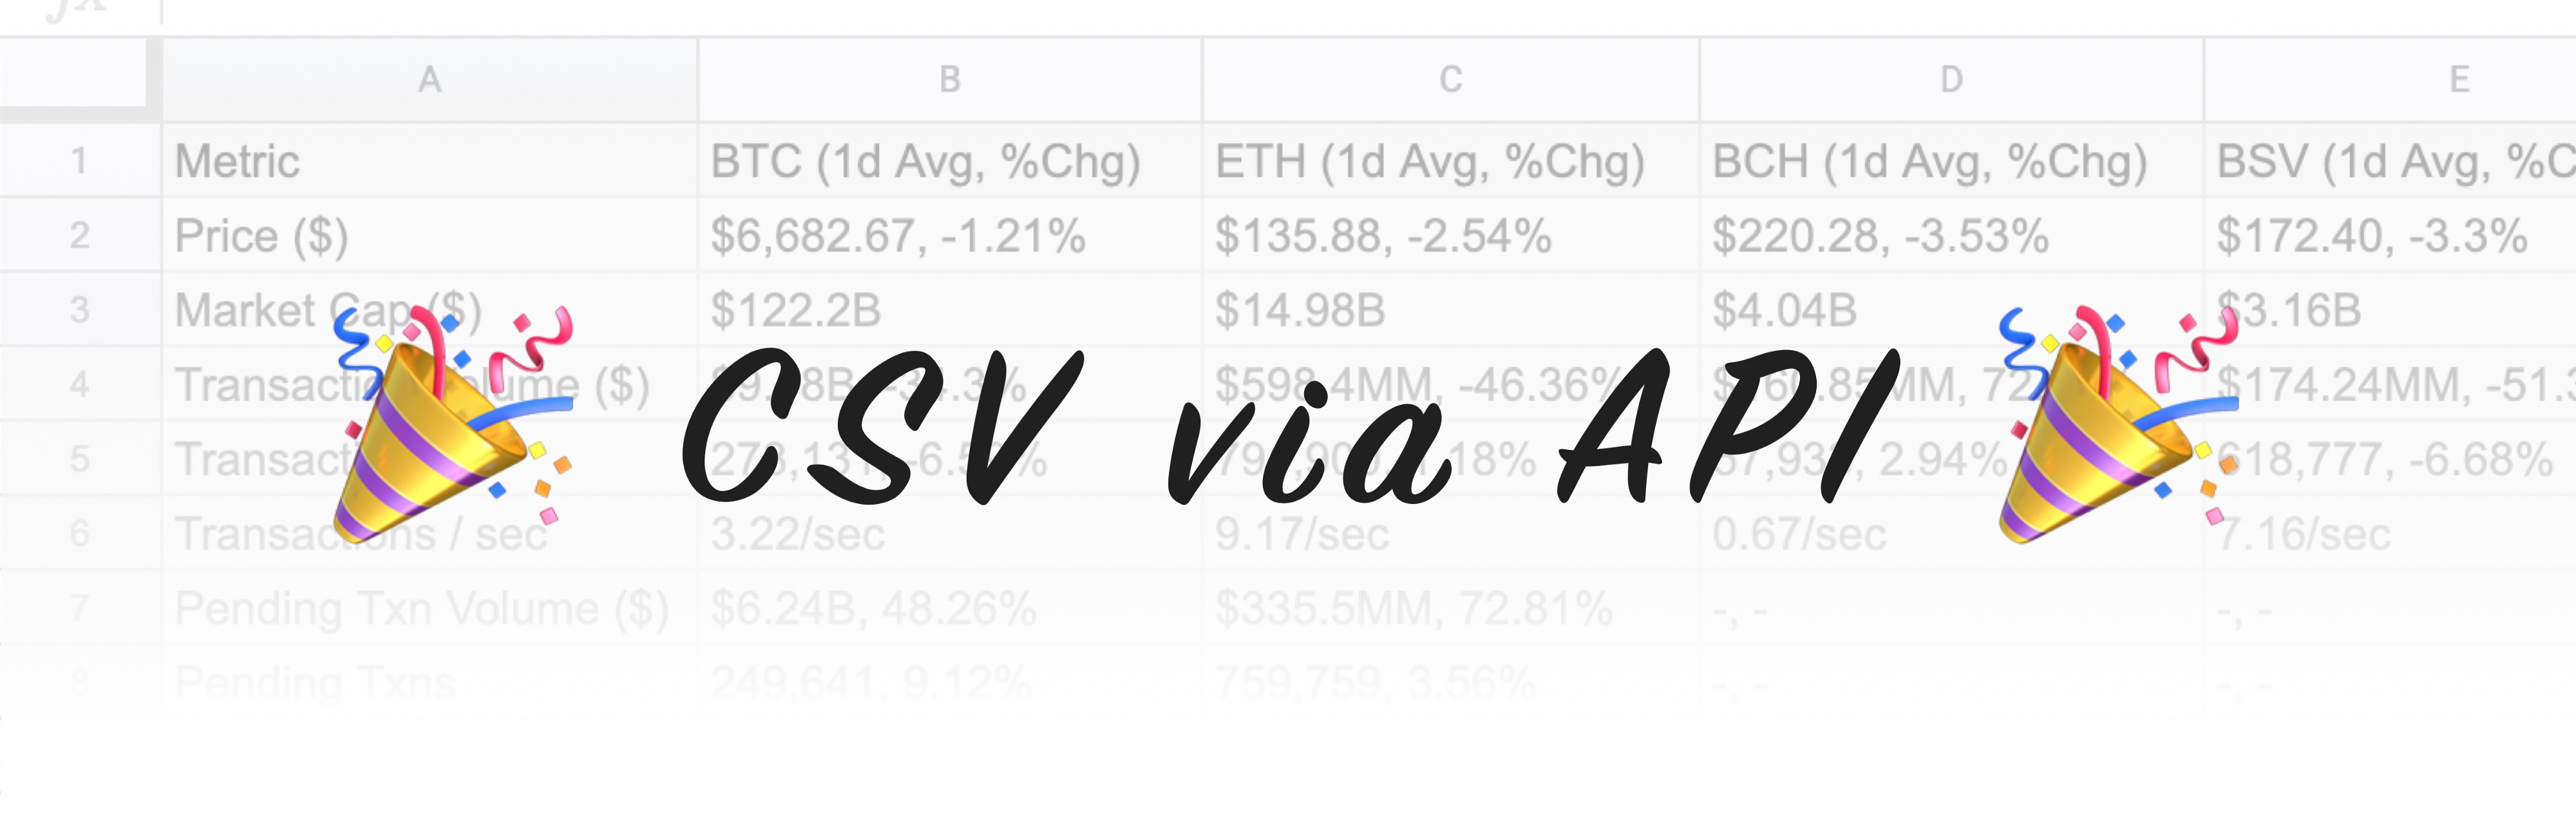
As of today, our API supports CSV responses in addition to JSON. Using CSV is as simple as:
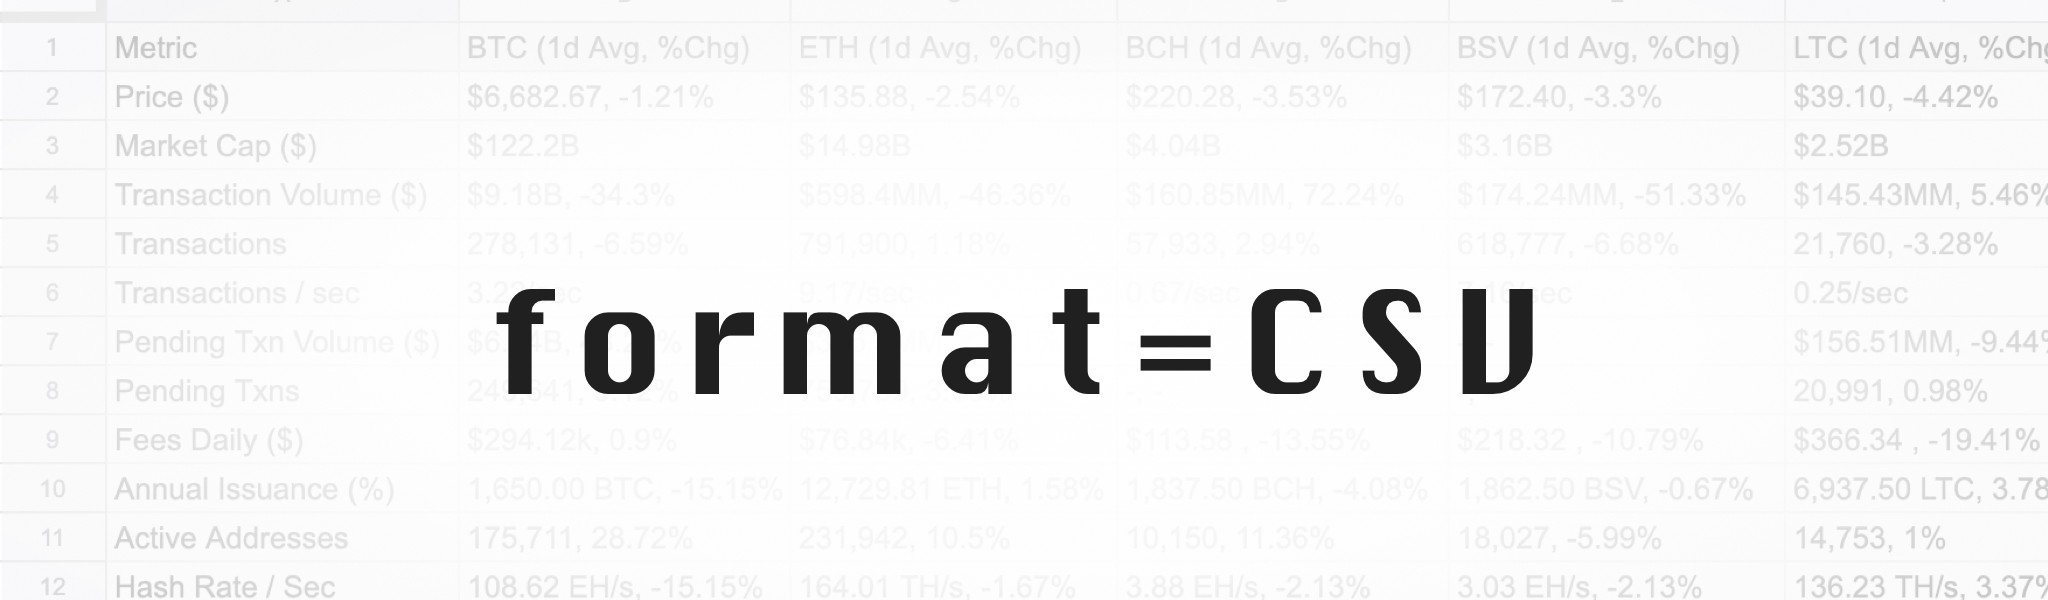
Add “format=csv” to the API endpoint
Why CSV?
Imagine you use excel, google sheets or like reading csv files. With only JSON as a data format, you need to manually convert the data into comma separated values, and format any data types that work for programs like excel. With CSV as an output option, you can now use the data without parsing to csv!
TLDR; See documentation here →
Here’s some of our best examples:
1. Historical Asset Price — View a digital asset movement over time
2. Blockchain Transactions — See network value transfer & activity
3. Account Balance — Portfolio holdings over time
4. Digital Asset Rankings — Generate reports covering entire digital asset class
But wait, there’s more! We’ve even added a superpower to csv formatting:
CSV Fields
You can define the fields you care about, in the order you want, and get a simplified data set to work with. This makes it especially powerful for running things in jupyter notebooks, charting in sheets, or filtering out the vast amount of data that is less important.
Here’s a quick example of how this works:
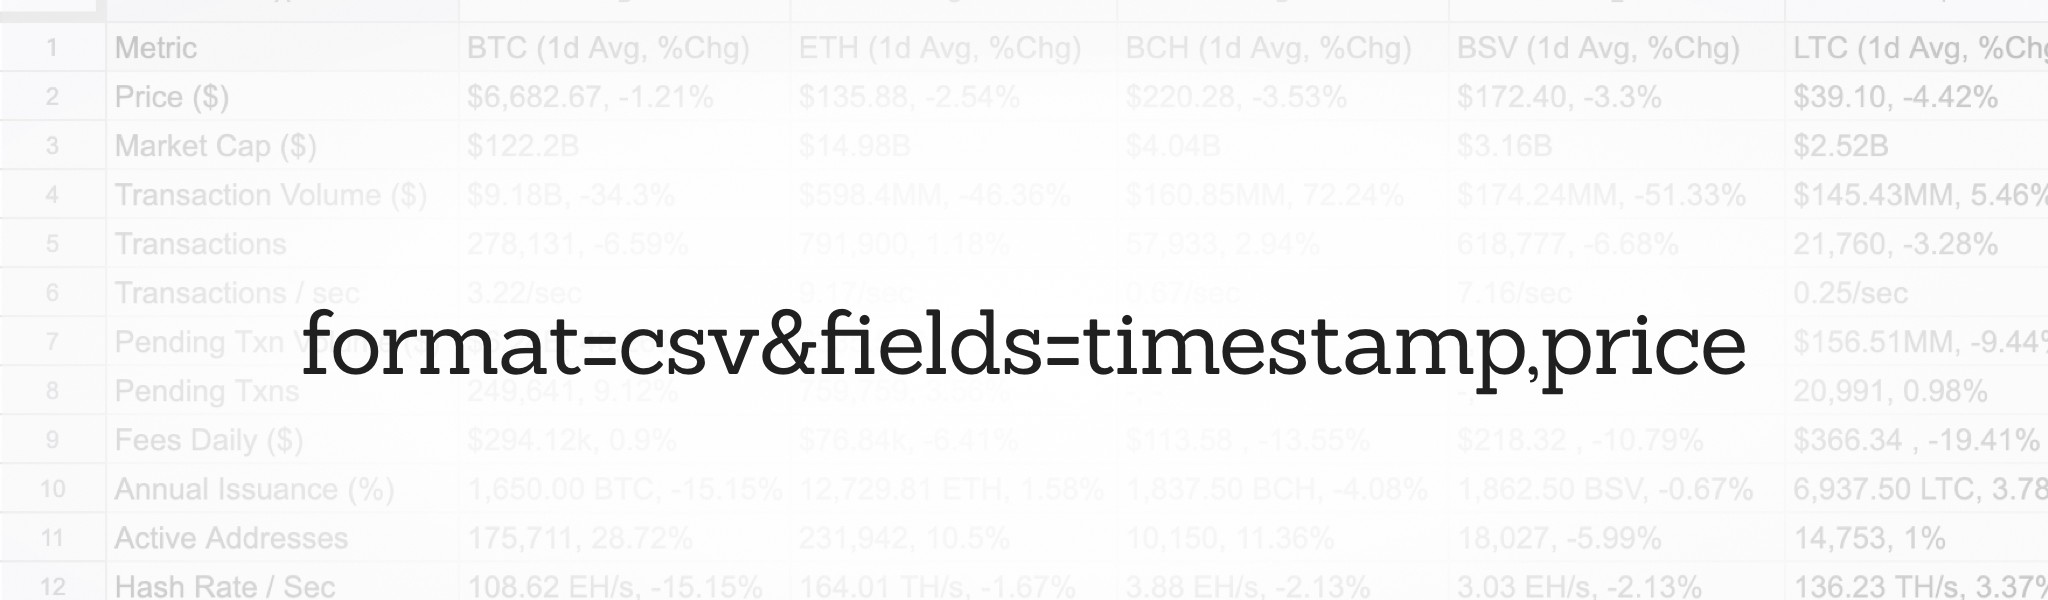
Add “format=csv&fields=timestamp,price” to the API endpoint
In the following chart, we request the timestamp, close and volume so we can see the movement over the past day. I then imported the csv into google sheets and selected charting.
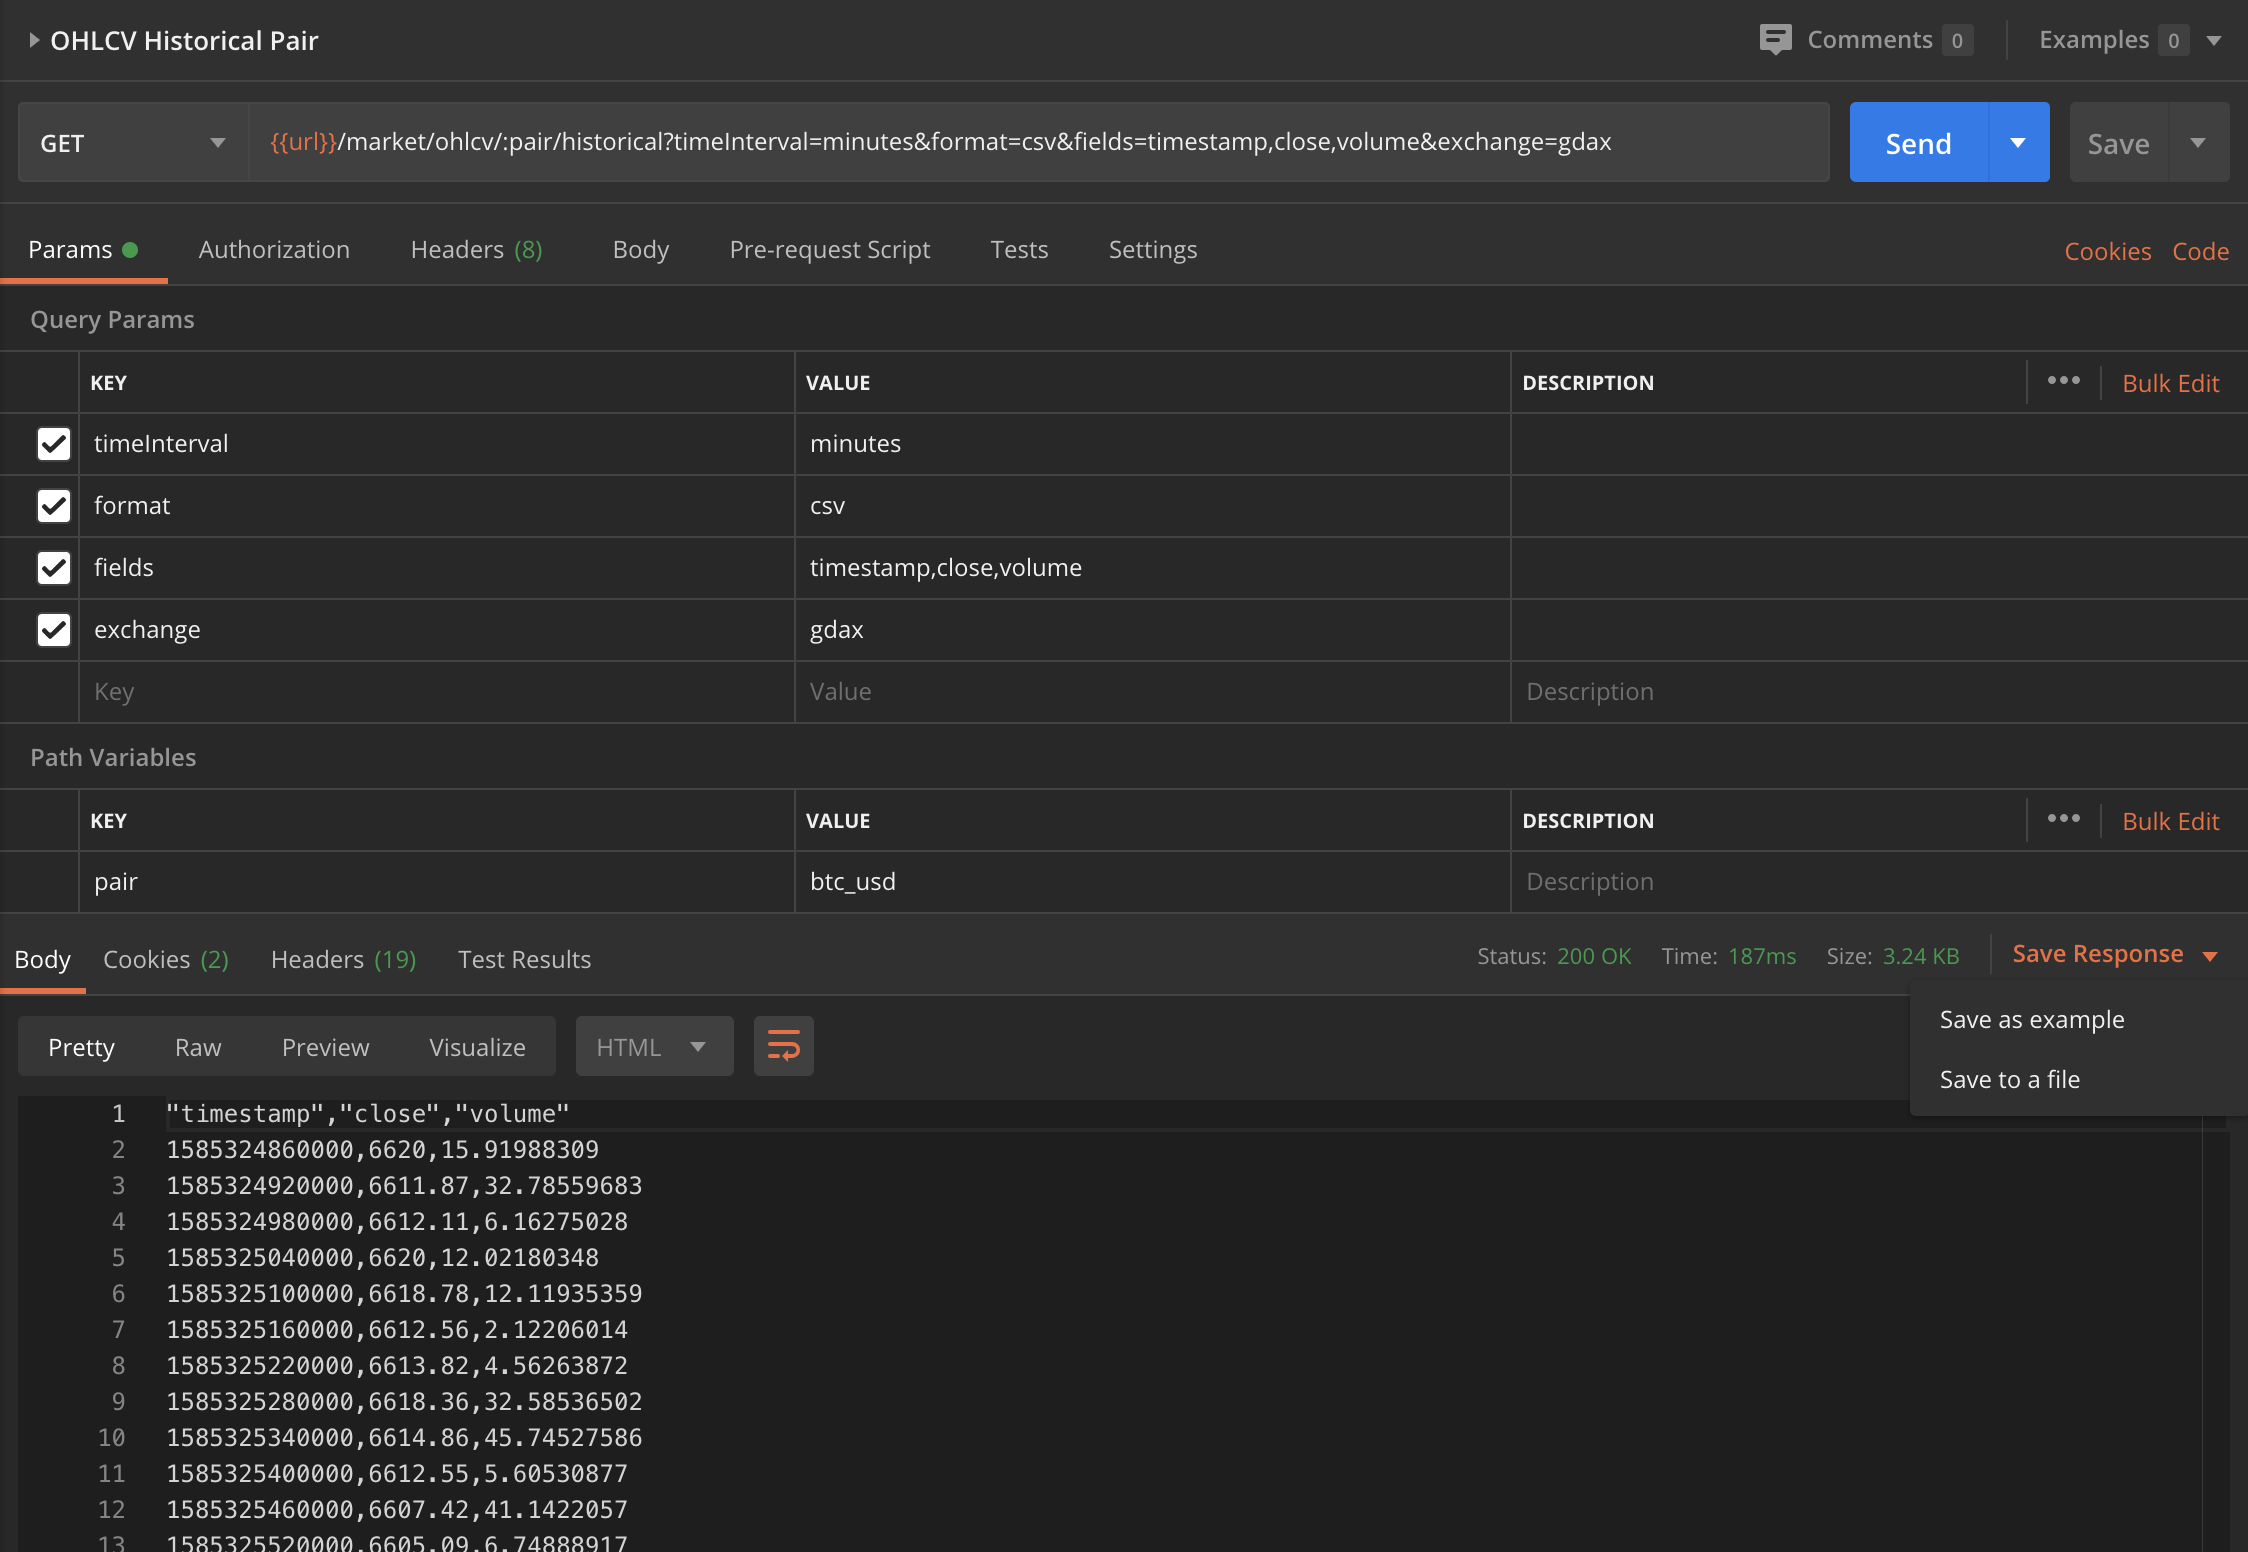
Using format=csv in Postman
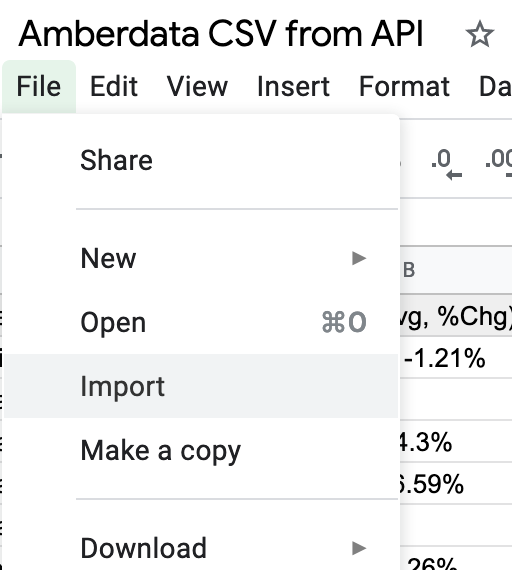
Import a csv file into google sheets
Open a new google sheets file, click “File”, then “Import”
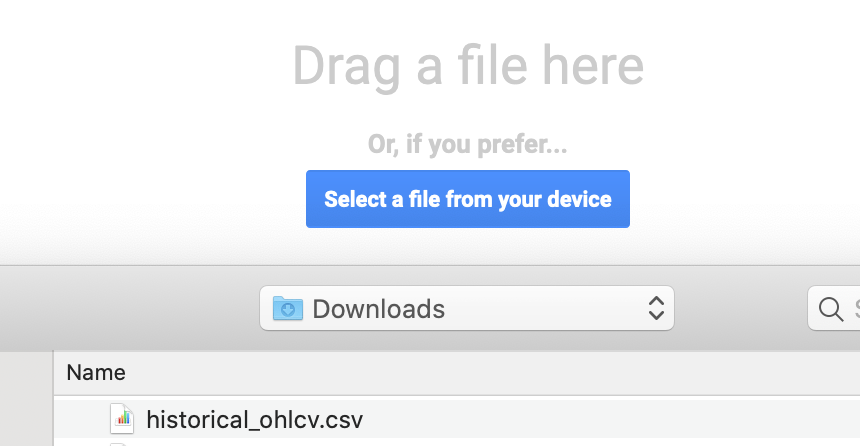
Upload the file from your computer, saved from Postman
Upload the file from your computer, saved from Postman. Select “replace” in the google prompt.
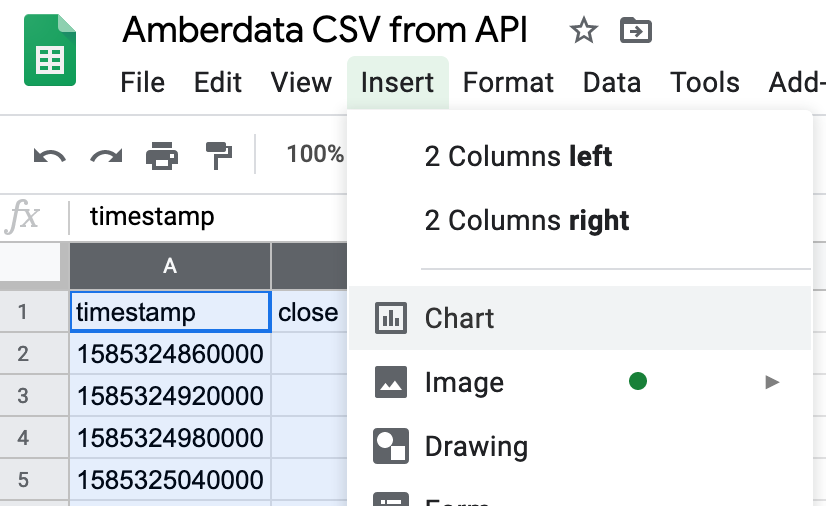
Select the columns
Select the columns you want to chart, then click “Insert”, then “Chart”. If you did everything right, you should see something great like this:
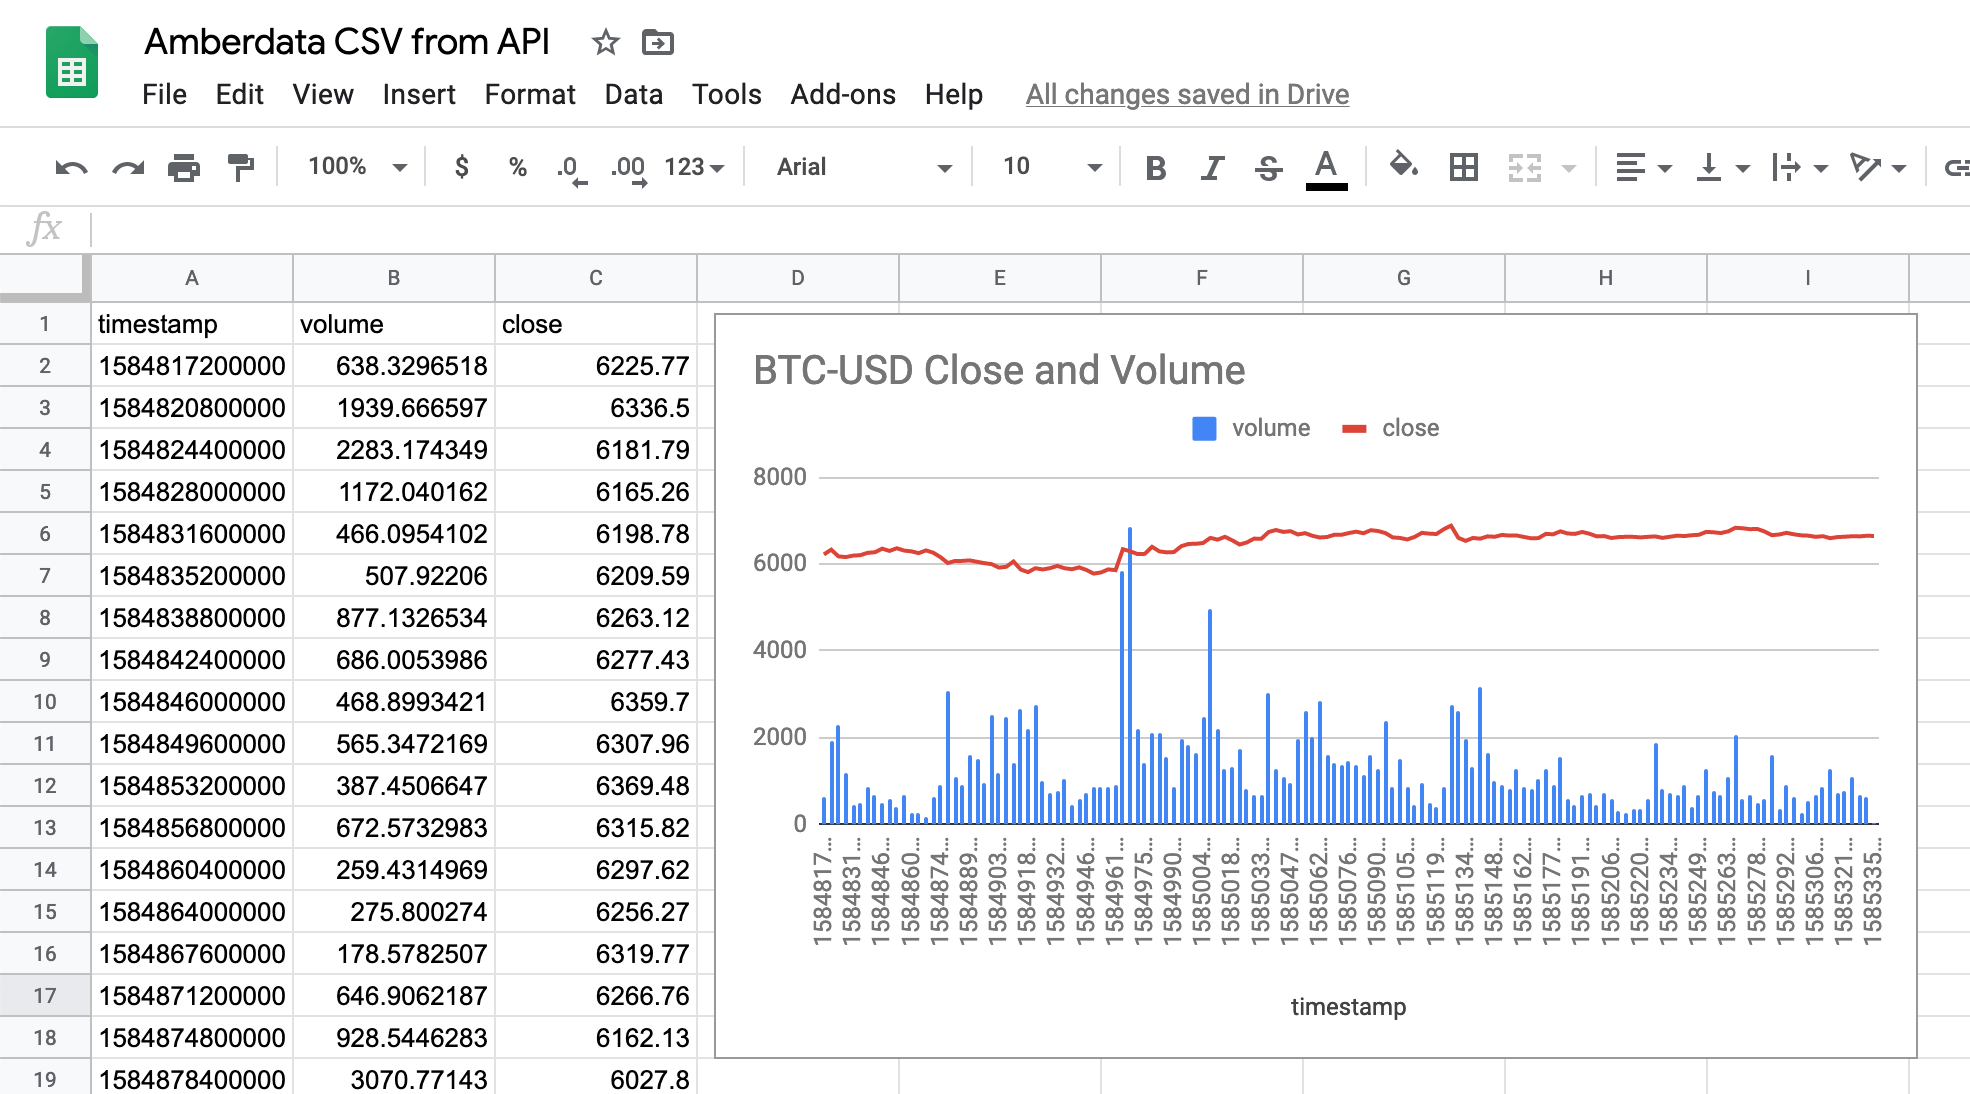
The CSV charted with Close & Volume of BTC USD data from Amberdata.io
This is huge! If you’re a non-developer, its as simple as using our Postman collection and google sheets to start working & understanding digital asset data!
This works for more difficult (yet powerful) examples as well:
- Address Balance: “/addresses/:hash/account-balances/historical?includePrice=true&format=csv&fields=timestamp,value,price”
- Blockchain Transactions: “/transactions?includePrice=true&format=csv&fields=blockNumber,value,fee,price_value_total,statusResult_name”
- Digital Asset Rankings: “/market/rankings?format=csv&fields=rank,symbol,currentPrice,marketCap”
We’ve got so much CSV for you, here’s the master list:
- /addresses
- /addresses/:hash/account-balances/historical
- /addresses/:hash/account-balances/latest
- /addresses/:hash/tokens
- /addresses/:hash/token-balances
- /addresses/:hash/transactions
- /addresses/:hash/pending-transactions
- /addresses/:hash/functions
- /addresses/:hash/logs
- /addresses/:hash/token-transfers
- /addresses/:hash/usage
- /addresses/:hash/adoption
- /addresses/metrics/latest
- /blocks
- /blocks/:number
- /blocks/:number/transactions
- /blocks/:number/token-transfers
- /blocks/:number/functions
- /blocks/metrics/latest
- /blocks/metrics/historical
- /uncles
- /uncles/:hash
- /tokens/:hash/holders/latest
- /tokens/:hash/holders/historical
- /tokens/:hash/volume
- /tokens/:hash/velocity
- /tokens/:hash/transfers
- /tokens/:hash/supplies/latest
- /tokens/:hash/supplies/historical
- /tokens/rankings
- /transactions/gas/percentiles
- /transactions/gas/predictions
- /transactions
- /transactions/:hash
- /transactions/:hash/token-transfers
- /transactions/metrics/latest
- /transactions/metrics/historical
- /market/trades/:pair/historical
- /market/tokens/prices/:hash/historical
- /market/tokens/prices/:hash/latest
- /market/prices/:base/wap/latest
- /market/tickers/:pair/latest
- /market/tickers/:pair/historical
- /market/ohlcv/:pair/latest
- /market/ohlcv/:pair/historical
- /market/rankings
- /market/prices/:pair/latest
- /market/prices/:pair/historical
BONUS FEATURE SNEAK PEEK:
Okay, actually I lied, this is already released!
We’ve updated our @Crypto bot, and its more powerful than ever.
The Amberdata.io Crypto bot for Digital Asset Data
You can use your favorite chat application to get digital asset information right within your conversations!
The chatbot is supported in Slack, Discord & Symphony!
Get started here →
Until next update, stay safe & healthy.