Share this blog:

Stablecoins are a vital aspect of any DeFi portfolio. They provide a safe haven from extreme market volatility and are the primary tokens for remittances. Many DeFi users take advantage of stablecoin price volatility with arbitrage trading, and others value them for the global ubiquity they provide. Stablecoins account for the largest token swap pools on decentralized exchanges (DEXs), are key pairs on a majority of centralized exchanges (CEXs), and are some of the most commonly loaned and borrowed assets in DeFi lending protocols.
The DeFi Lending ecosystem relies heavily on stablecoins to enter and exit positions. Using Amberdata’s Stablecoin Lending Metrics endpoints, we visualized the use of stablecoins in popular DeFi lending and borrowing protocols and evaluated how the lending landscape has changed over time.
Stablecoin Lending Landscape
The DeFi Lending landscape primarily consists of two key activities: depositing and borrowing funds. Users place funds into a protocol to earn yield through a percentage of protocol fees from other users’ activity or with protocol incentives such as token rewards. Users who borrow funds must maintain a certain level of collateral or risk being liquidated. As a reward for maintaining protocol health, liquidating dangerous positions often allows users to capture rewards such as a percentage of the amount liquidated.
Stablecoins are valued for their simplicity and low volatility relative to other cryptocurrencies and have become a cornerstone of DeFi lending protocols. Depositors can easily predict their collateral ratios using stablecoins, whereas volatile tokens make estimating collateral ratios over time much more unpredictable. Borrowers can also easily predict fees for borrowing and repayments.
Stablecoin Deposits
The base of all DeFi lending comes in the form of deposits. Amberdata’s Stablecoin Lending Metrics endpoint provides a wealth of information for analyzing and understanding the landscape of lending, including metrics for deposits and withdrawals. Stablecoin metrics using this endpoint can be analyzed by token, protocol, and network. For metrics focused on specific wallets or addresses, Amberdata’s DeFi Lending Wallet endpoint provides a lens into transaction-level details.
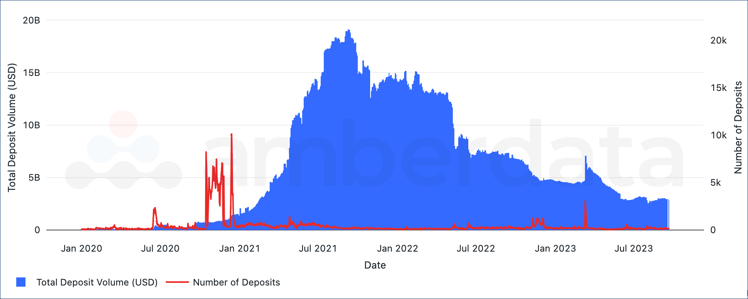
Total stablecoins deposit volume and counts in DeFi Lending protocols between January 2020 and September 2023 by network.
The emergence of DeFi Lending began in earnest in 2020 as several new protocols began to emerge from development onto mainnet. While developers launched their products, a wave of new users arrived to test these protocols, bringing an inflow of small deposits.
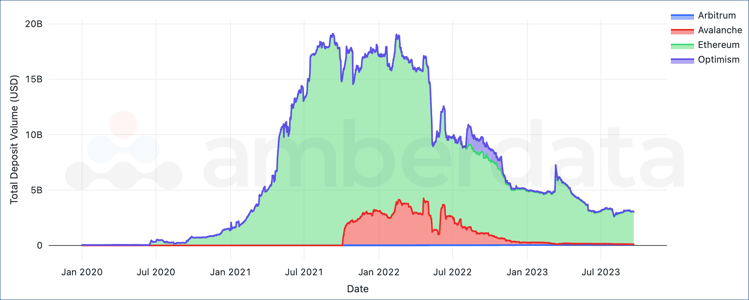
Total stablecoins deposited in DeFi Lending protocols between January 2020 and September 2023 by network.
Because other networks had not yet launched, these deposits landed mostly on Ethereum. Across Arbitrum, Avalanche, Ethereum, and Optimism, the peak volume of stablecoins deposited into DeFi Lending protocols has reached nearly $20 billion.
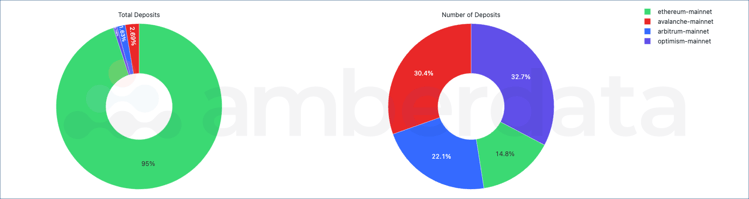
Stablecoin deposit volume and counts on DeFi Lending protocols between August 2023 and September 2023 by network.
The total amount of stablecoins deposited into DeFi lending pools (deposits) since August 2023 almost completely took place on Ethereum, which had almost 95% of deposit volume occur on the network despite having only 15% of the transaction count. In other words, fewer large deposits are occurring on Ethereum than any other network and indicates that the general adoption of other networks is still lagging.
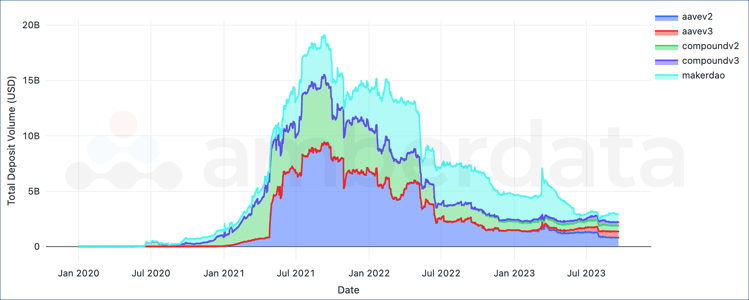
Total stablecoins deposited in DeFi Lending protocols between January 2020 and September 2023 by protocol.
MakerDAO’s founding in 2014 and the release of DAI in 2017 started a wave of lending protocol creation. MakerDAO didn't start making strides until the introduction of Multi-Collateral Dai, which allowed for the use of multiple stablecoins and led to the wave of stablecoin borrowing/lending during DeFi Summer 2020. Compound v2 (followed by Compound v3) gained popularity during this time, aided by the June 2020 airdrop of their governance token (COMP) airdrop. Since then, Aave has grown to take the majority of the lending deposit market share, with Aave v2 launched at the end of 2020, and Aave v3 in 2022.
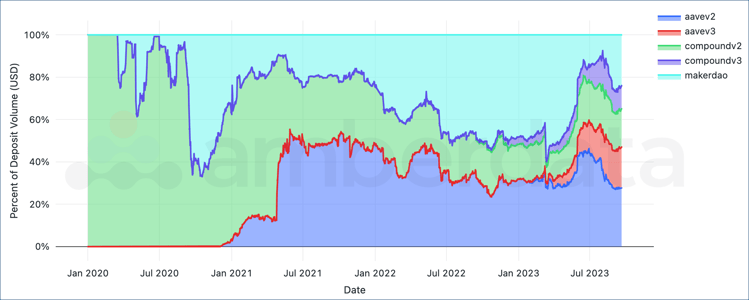
Daily stablecoins deposit percentages in DeFi Lending protocols between January 2020 and September 2023 by protocol.
Looking at the deposit volume breakdown, Compound (v2 and v3) currently have around 30% of the stablecoin lending market, while Aave (v2 and v3) have taken almost 45% of the total value locked (TVL).
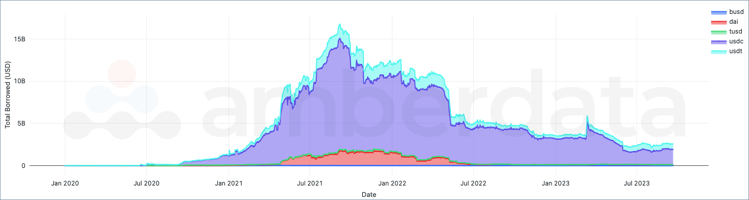
Total stablecoins deposited in DeFi Lending protocols between January 2020 and September 2023 by stablecoin.
Between these protocols, USDC has been the main stablecoin deposited into various lending protocols. Despite its major depegging event in 2023 during the Silicon Valley Bank collapse, fiat-backed USDC is often regarded as one of the most secure stablecoins. USDT is the largest stablecoin by market cap and follows USDC as the second-most deposited stablecoin. These two tokens take a large majority of the stablecoin market share by market capitalization, so it is no surprise that they are the most deposited stablecoins for lenders.
Interest Earned & Interest Paid to Stablecoin Pools
Deposits generate yield in the form of interest for both the lender and the protocol. Together, these revenues ensure that both lenders and borrowers can maintain liquidity, while also incentivizing investors to leverage assets for both the long and short term.
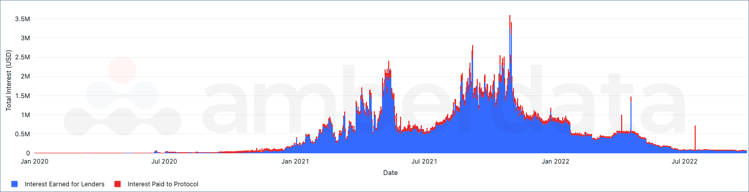
Interest earned for lenders and protocols to stablecoin pools between January 2020 and September 2023.
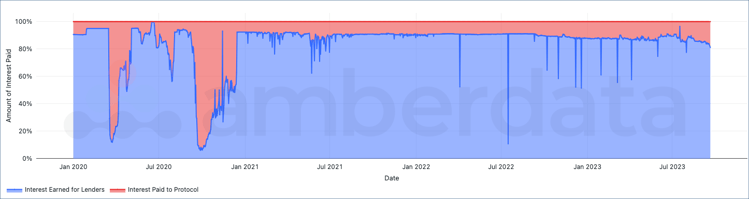
Distribution of interest earned for lenders and protocols to stablecoin pools between January 2020 and September 2023.
For lenders, daily interest earned peaked in 2021 and reached as high as $3M daily interest, while protocols earned nearly $350,000 in daily protocol fees. As on-chain activity has decreased significantly since its 2021 highs, interest payments have also decreased.
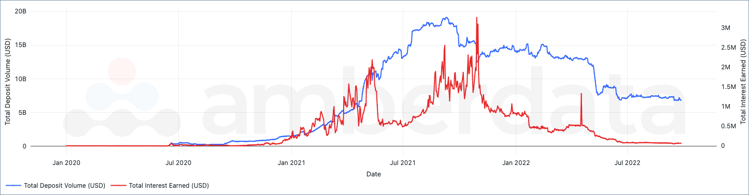
Total deposit volume and interest paid to stablecoin pools between January 2020 and September 2023.
Interest payments typically remained in line with deposits, since deposits are what earn interest for users. However incentives such as airdrops or additional pool rewards were commonplace in 2020 and 2021 as protocols were competing for users or hoping to retain them.
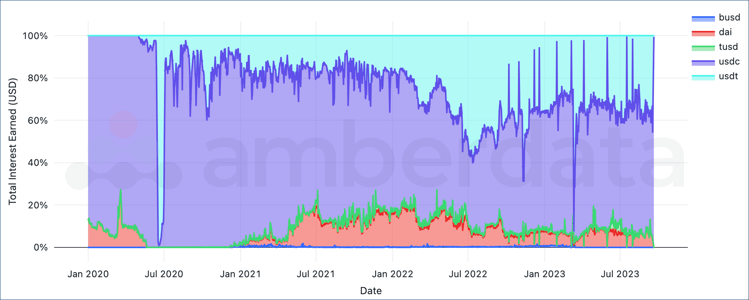
Total interest earned on stablecoin pools between January 2020 and September 2023 by a token.
Looking at the breakdown of interest earned by tokens, USDC and USDT pools earn the majority of protocol fees for lenders. These stablecoins are both the most lent and borrowed tokens. After major depegging events in 2020 and 2023, USDC interest earned quickly vanished as lenders moved to USDT until USDC regained its peg days later.
Learn more about Lending Stablecoins: Aggregate Analytics as this is just a subset of the report. In the rest of the report, we go through many more analytics including deposit utilization, borrows vs. repaid & liquidated, liquidations, and profits.
Download the complete research report here:
