Share this blog:

Last week we saw notable movements in ETH and BTC. ETH and BTC briefly surged above $3,700 and $72,000 respectively before retracing to levels around $3,500 for ETH and $69,000 for BTC. The resistance at $3,500 for ETH and $70,000 for BTC appears to be a significant barrier. The focus is now on Bitcoin as we near the anticipated halving event on April 20th. There is speculation about whether this event is already factored into the price. While it's believed that the halving may not significantly affect prices in the short term, the increasing scarcity of Bitcoin could drive prices to new all-time highs in the second quarter.
Significant progress within the blockchain ecosystem includes the launch of the EigenLayer Mainnet, which has achieved a Total Value Locked (TVL) exceeding $12 billion. This launch marks a significant milestone in the evolution of the restaking domain, enabling stakeholders within EigenLayer to delegate to operators. This development represents the initial steps towards Ethereum enhancing security across new networks. To date, 231,718 units have been delegated across 106 different delegators. The momentum surrounding EigenLayer is expected to continue escalating throughout the second quarter.
In other news, Uniswap received a Wells notice from the SEC earlier this week. A Wells notice is a warning letter sent from the SEC, typically as a precursor to legal action. Notable entities that have also received Wells notices in the past include Paxos and Coinbase. The notice warned Uniswap that it has been acting as an unregulated securities exchange. Hayden Adams, the founder of Uniswap, claims that he is “disappointed, and ready to fight.” Coinbase offered similar remarks when they received their Wells notice, demonstrating the crypto community’s commitment to not going down without a fight. The results of both of these lawsuits will be foundational to the industry, but for now, we likely will not see a decision for years. Typically, regulatory action can be a bearish indicator, but as of now, Bitcoin continues to hover around its $70k resistance line.
Spot Market
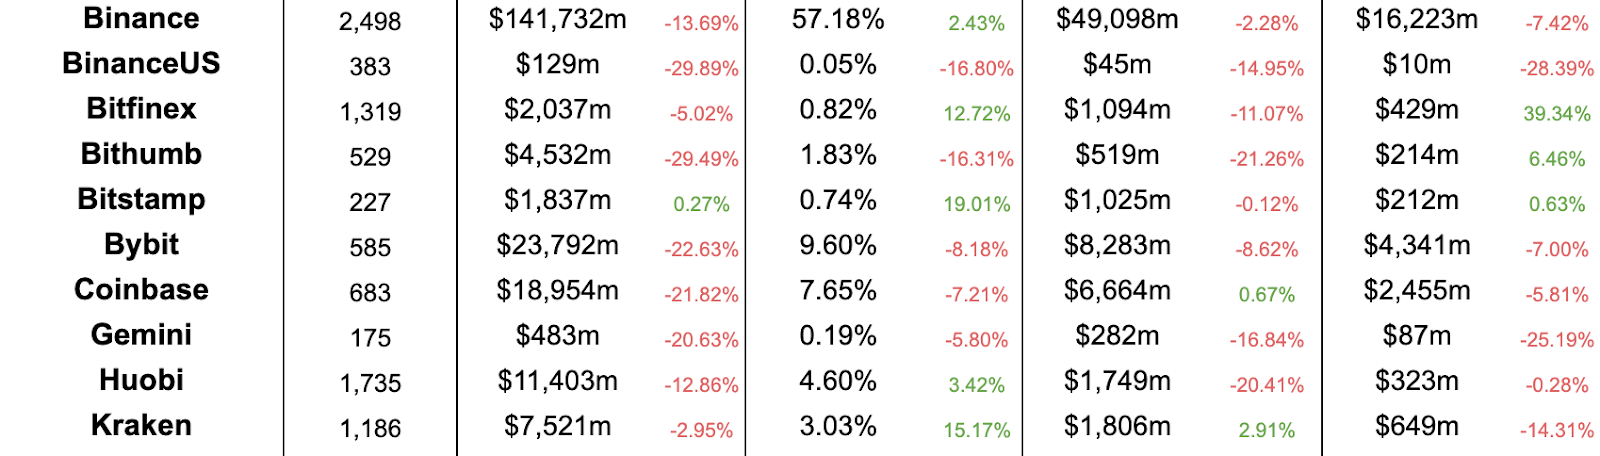
Centralized Exchange (CEX) comparisons from weeks 4/2/2024 and 4/9/2024
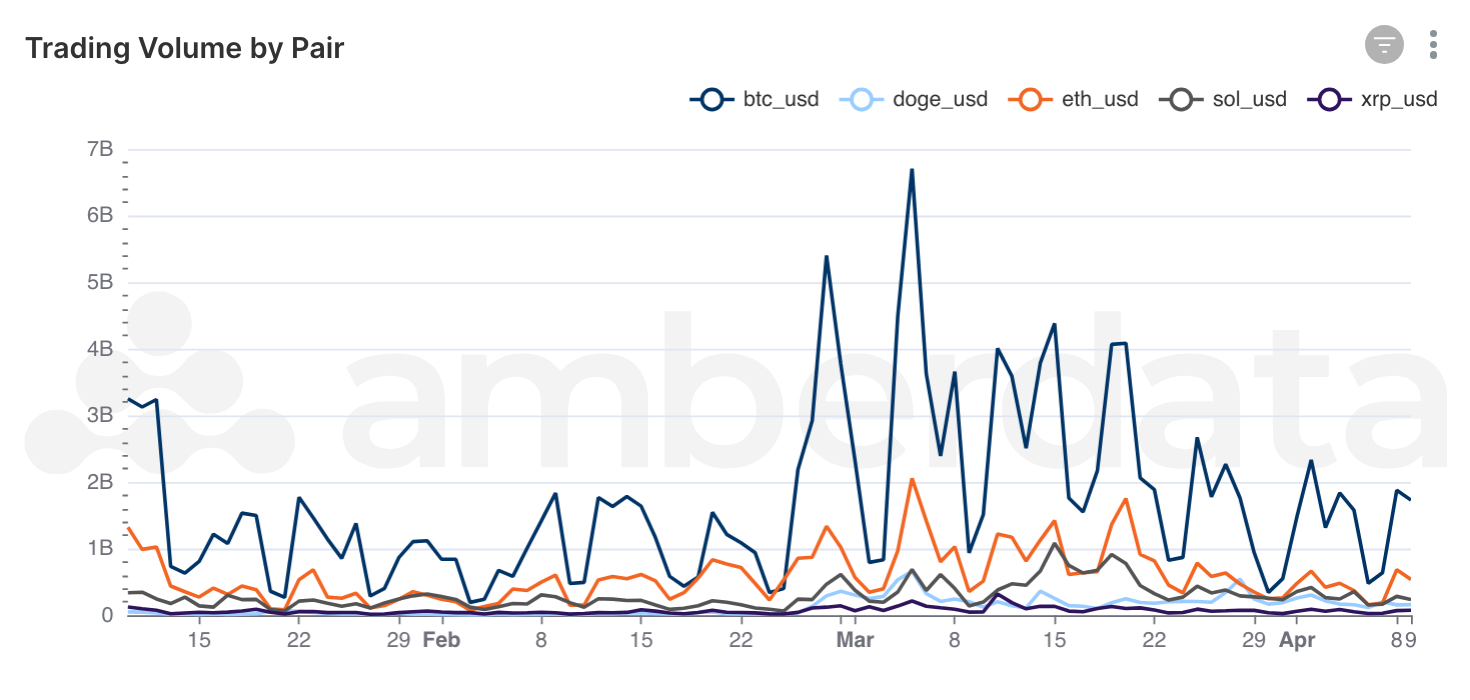
Trading Volume by Pair for major token pairs
We are seeing a cooling in trading volume for CEX’s most valuable pair, BTC_USD. In early March, CEXs reached highs of 6.5B dollars in trading volume, whereas in April they are hitting highs of 2.5B dollars. This high is still respectable of course, but indicates that we may not see large vertical movements in price as demand slows. The next few weeks will be critical for determining the strength of this bull market: if we continue to see a negative trend in trade volume, it is unlikely that we will see a breakthrough of higher BTC prices.
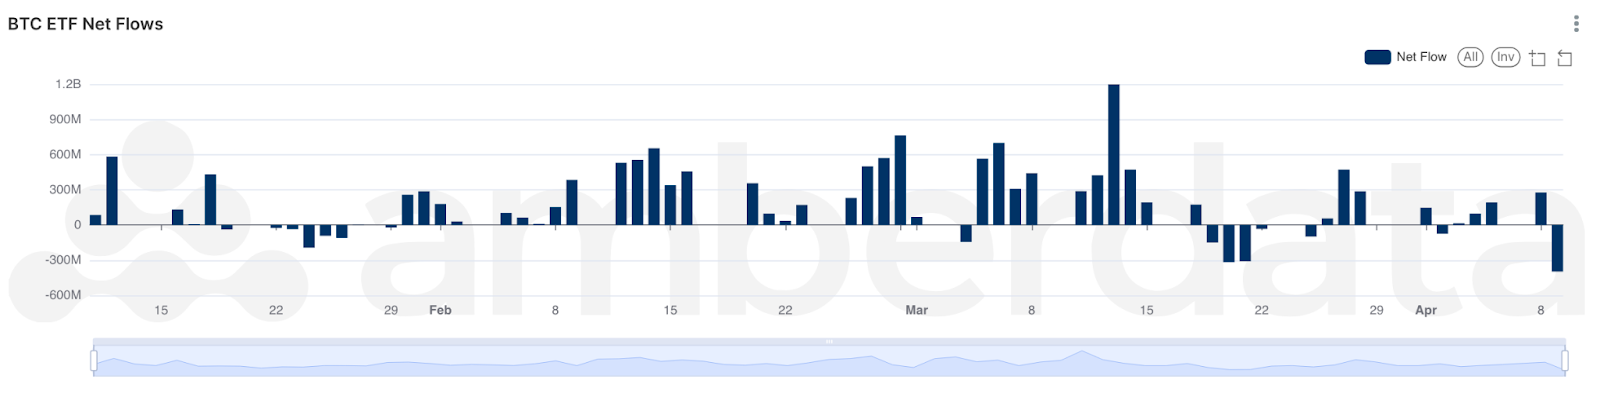
BTC ETF flows over the past quarter
This cooling effect can be observed in ETF demand as well. Though there was strong demand earlier in March, overall demand has significantly decreased from a 1.2B net inflow to ETFs in mid-March to low 100M dollar inflows and outflows in April. With the Halvening around the corner, we should keep an eye out for a rally as users collect Bitcoin before supply is halved.
DeFi DEXs

Decentralized Exchange (DEX) protocol from weeks 4/2/2024 and 4/9/2024
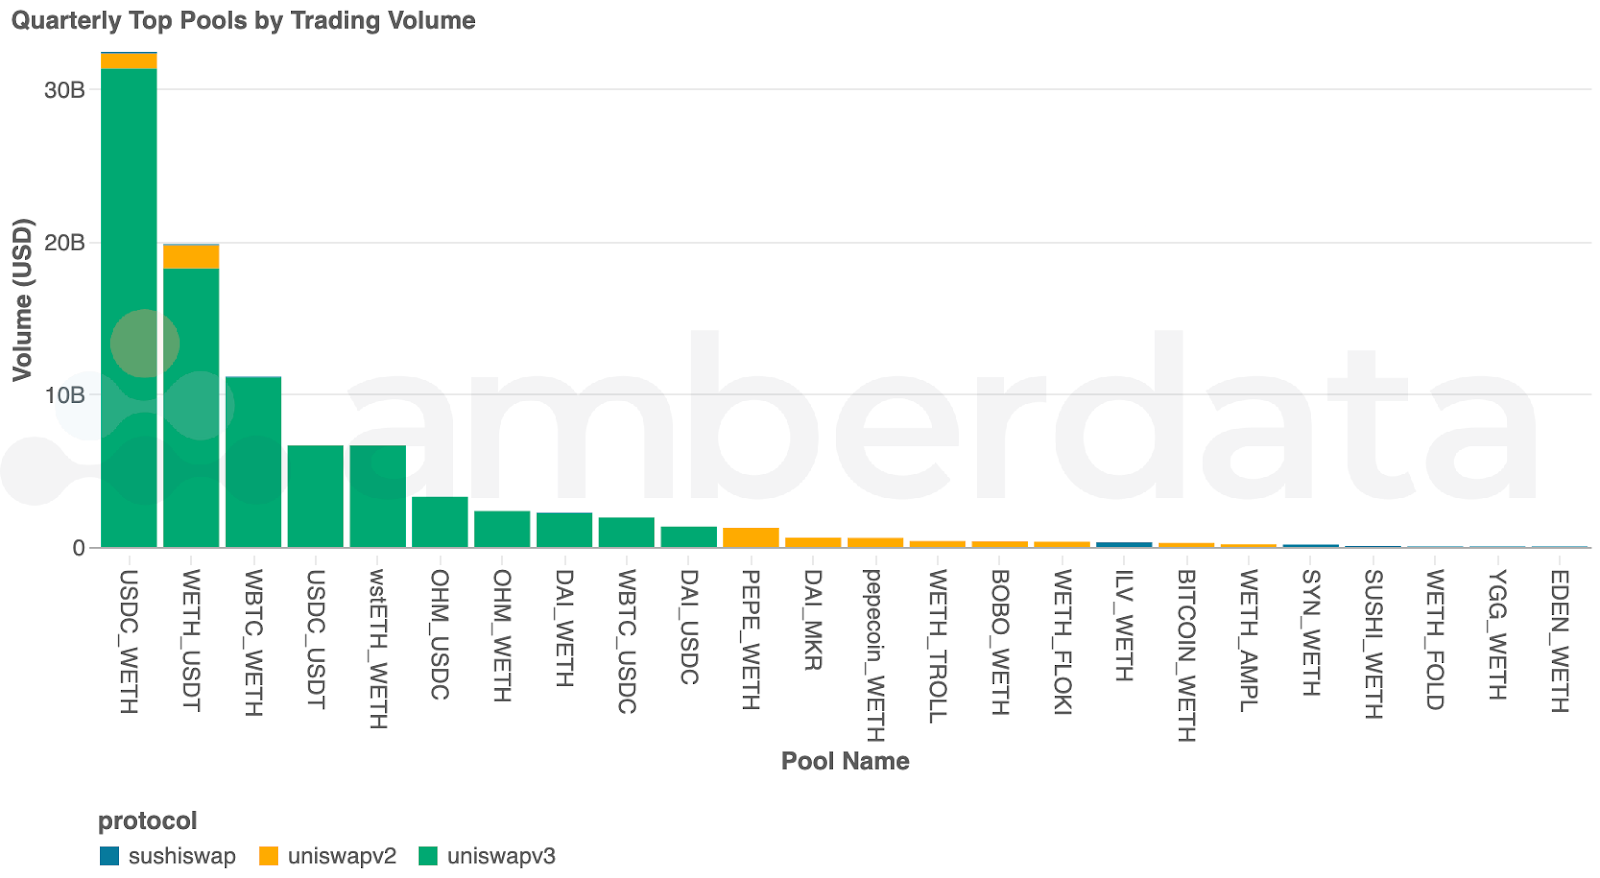
Top DEX trading pairs over the past quarter
Given that we have finished Q1, we can take a look at the big winners of the bull cycle in Q1. Of course, at the top is USDC_WETH on Uniswap V3, the undisputed king of trading pairs in the DEX world. WBTC_WETH is in third, significantly higher than in previous quarters, likely due to the volatility in BTC’s meteoric rise to the top. PEPE_WETH appears to have fallen by the wayside. Once one of the top coins in 2022, it now sits outside of the top 10 pools. Likely as the current bull cycle cools, we will see some renewed interest in the meme coin game.
DeFi Borrow/Lend

DeFi Lending protocol comparisons from weeks 4/2/2024 and 4/9/2024
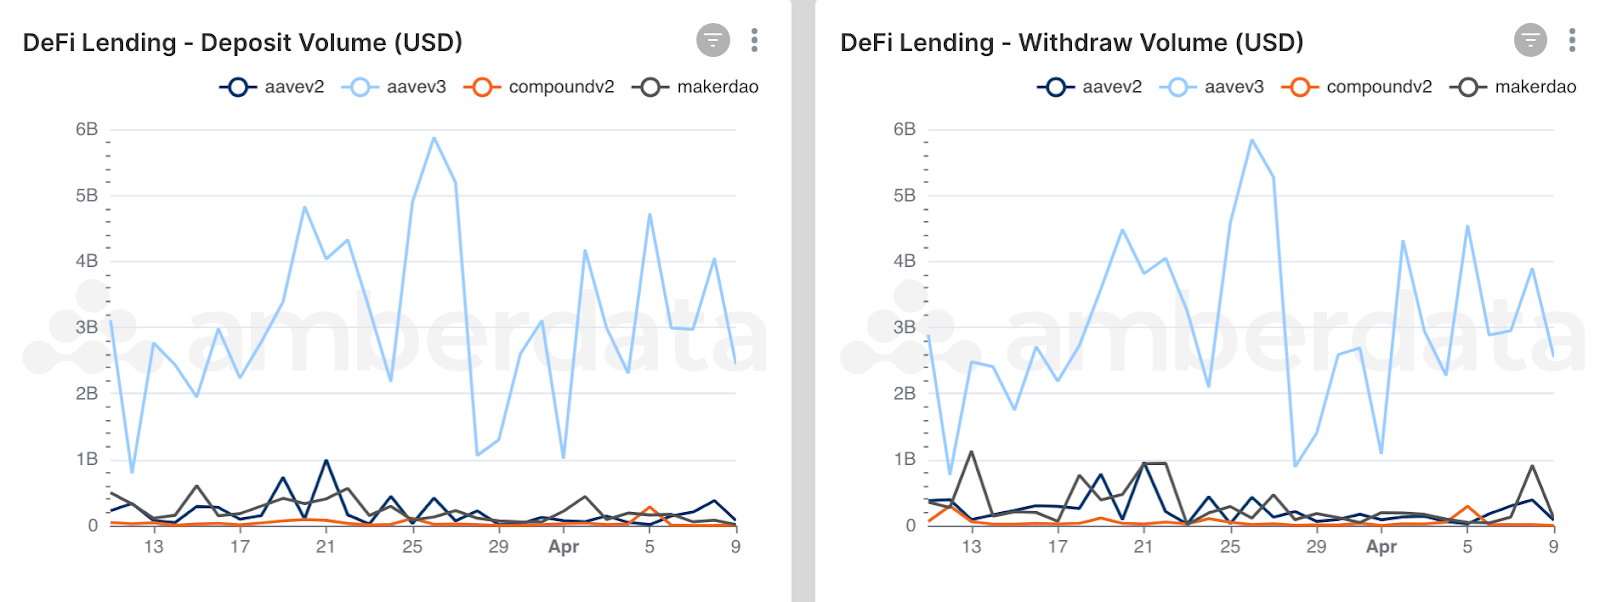
DeFi Lending deposit and withdraw volumes over the last 30 days
Over the past month, we have seen an overall net outflow from DeFi Lending protocols - a troubling sign for the overall health of the protocol. Especially within the last two weeks, MakerDao has strongly contributed to the overall withdrawal volume push. With many other attractive opportunities to gain yield such as via liquid staking tokens and L2s, it is no surprise to see L1 lending protocols with relatively lower rewards struggling to compete. That said, there is likely nothing catastrophic heading their way, as deposits are still well within the billions of dollars.
Networks
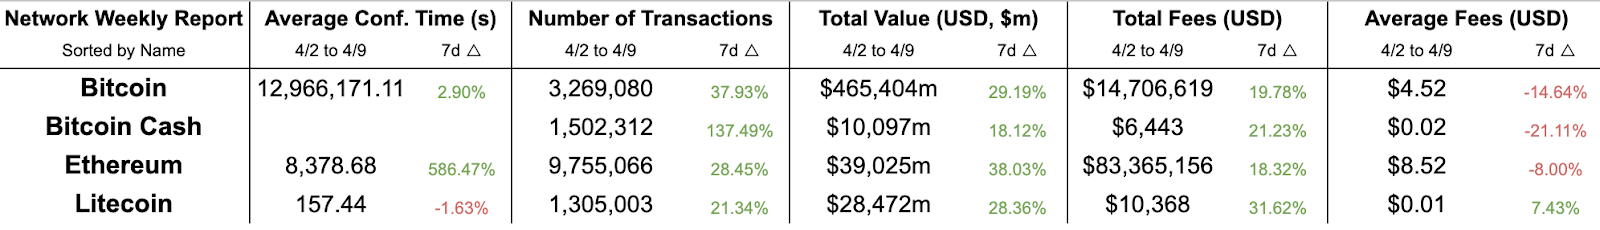
Network comparisons from weeks 4/2/2024 and 4/9/2024
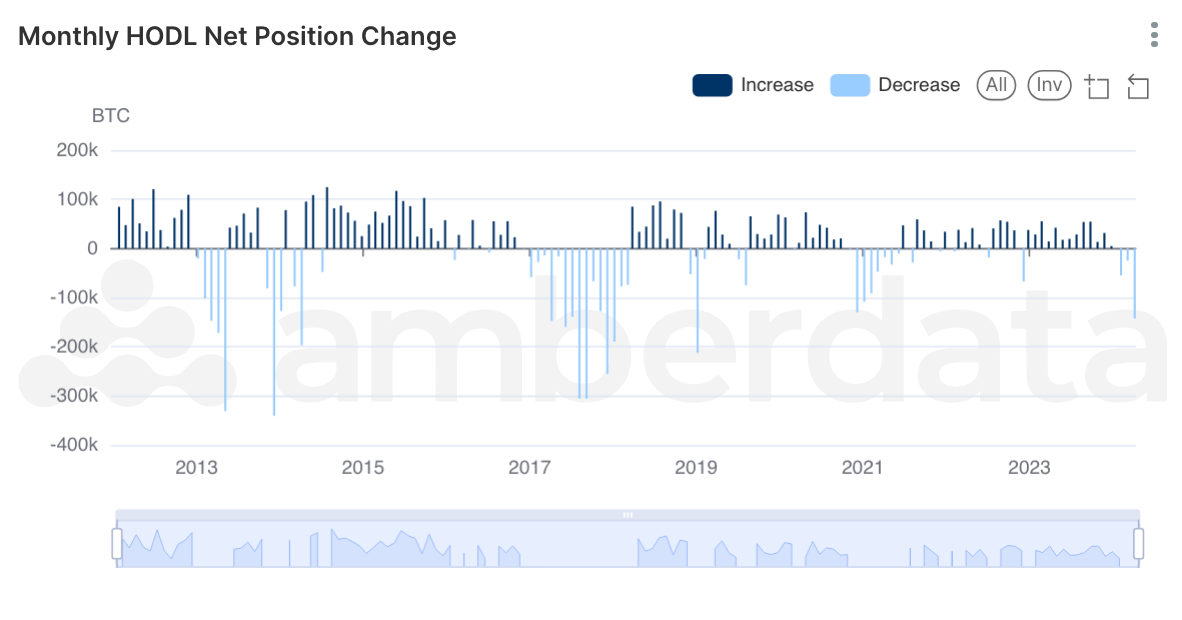
Monthly HODL Net Position Change. A significant drop in HODL’d coins shows that people are selling.
As expected, we see an overall decrease in the number of HODL’d coins for April, with a staggering 142k drop in HODL’d coins. If we take it with the current value of BTC at ~$70k, that is roughly $10B in realized gains for BTC hodlers. This drop in HODL’d coins makes sense, considering we saw all-time highs for Bitcoin in March. Steep drops in HODL’d coins are hallmark signs of bull run cycles, as evidenced by the drop in HODL’d coins in the graph above.
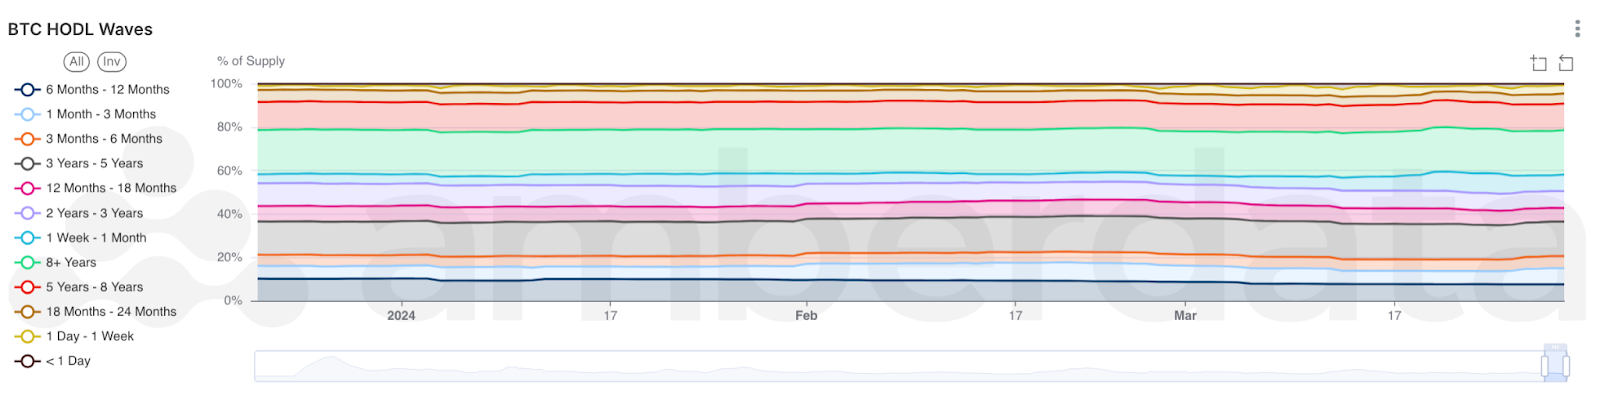
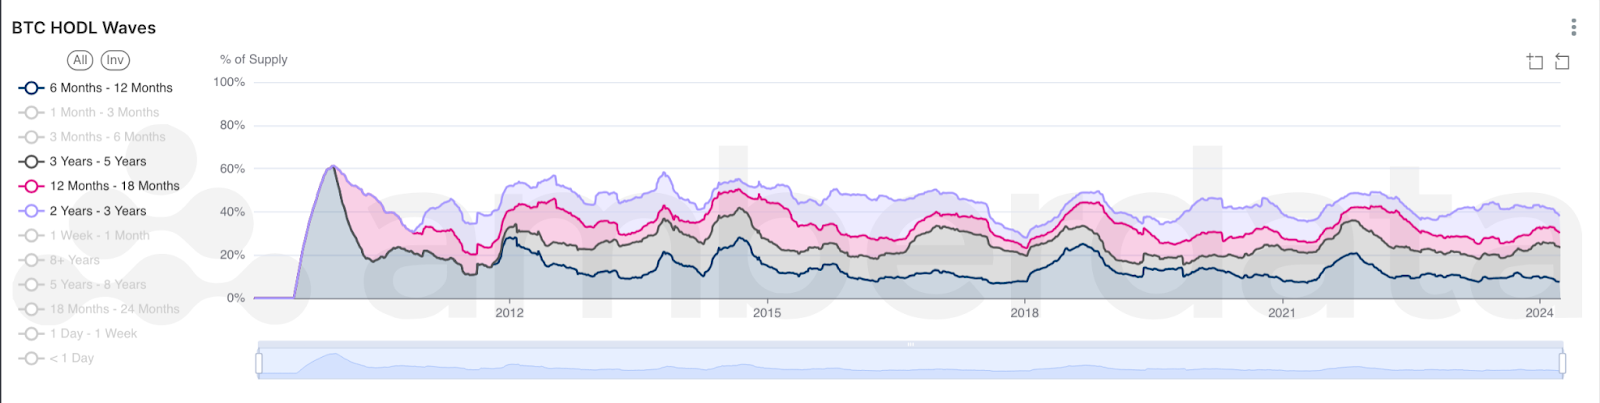
BTC HODL Waves over the past quarter and BTC HODL waves for a subset of buckets, showing a drop in HODL’d coins.
Intrinsically linked with HODL position change are Bitcoin Hodl Waves, which give us insight into what coins are being moved. It seems that most of the drops in Bitcoin come from a 6-month to 3-year supply bucket. We saw these buckets drop ~1% from last month, which most likely accounts for most of the movement we see in HODL net position change. This is interesting because it shows that BTC holders who came in during the last bull run are selling their holdings, likely to reclaim the losses they faced during the bear market. On the bright side, all other long-term buckets (i.e., HODLers > 5 years) are still holding strong, and continue to grow as one of the largest percentages of held supply in the network.
Links
Recent from Amberdata
- Amberdata: Real-World Asset Tokenization Primer
- Amberdata: Providing Liquidity? How to monitor a Pool’s Smart Contract in real-time
- Amberdata: The ultimate guide to funding rate arbitrage
AmberLens: intelligence.amberdata.com
Spot Market
Spot market charts were built using the following endpoints:
- https://docs.amberdata.io/reference/market-metrics-exchanges-volumes-historical
- https://docs.amberdata.io/reference/market-metrics-exchanges-assets-volumes-historical
- https://docs.amberdata.io/reference/get-market-pairs
- https://docs.amberdata.io/reference/get-historical-ohlc
Futures
Futures/Swaps charts were built using the following endpoints:
- https://docs.amberdata.io/reference/futures-exchanges-pairs
- https://docs.amberdata.io/reference/futures-ohlcv-historical
- https://docs.amberdata.io/reference/futures-funding-rates-historical
- https://docs.amberdata.io/reference/futures-long-short-ratio-historical
- https://docs.amberdata.io/reference/swaps-exchanges-reference
- https://docs.amberdata.io/reference/swaps-ohlcv-historical
- https://docs.amberdata.io/reference/swaps-funding-rates-historical
DeFi DEXs
DeFi DEX charts were built using the following endpoints:
- https://docs.amberdata.io/reference/defi-dex-liquidity
- https://docs.amberdata.io/reference/defi-dex-metrics
- https://docs.amberdata.io/reference/defi-impermanent-loss
DeFi Borrow/Lend
DeFi lending charts were built using the following endpoints:
- https://docs.amberdata.io/reference/defi-lending-protocol-lens
- https://docs.amberdata.io/reference/defi-lending-asset-lens
Networks
Network charts were built using the following endpoints:
- https://docs.amberdata.io/reference/blockchains-metrics-latest
- https://docs.amberdata.io/reference/transactions-metrics-historical
- https://docs.amberdata.io/reference/get-historical-transaction-volume
