Share this blog:
In global finance, unexpected connections can have wide-reaching effects. A recent example is the unwinding of the yen carry trade, which has impacted not just traditional markets but also cryptocurrencies. This shows how closely connected financial markets have become, raising questions about whether cryptocurrencies are really the safe-haven assets they are often considered to be.
The yen carry trade involves borrowing yen at low interest rates to invest in higher-yielding assets. However, recent changes in Japan's policies and global interest rates forced many traders to unwind these positions, causing significant disruptions across various markets. While stocks and bonds were affected first, the impact quickly spread to crypto, with Bitcoin dropping 8%, far more than gold’s 1% decline. This sharp drop in crypto highlights how vulnerable digital assets can be to major global financial events.
Could we have seen this coming? Were there signs in the market—like changes in order book behaviour, shifts in liquidity, or spikes in trading activity—that hinted at the coming volatility? By looking at these indicators, traders can gain valuable insights into market conditions before big price moves happen.
In the following sections, we’ll explore how these tools can help traders spot potential risks and opportunities, and whether they could have warned us about the effects of the yen carry trade unwinding before the price action unfolded. Understanding these signals is key to navigating the increasingly connected world of traditional finance and crypto.
Understanding the Price Action
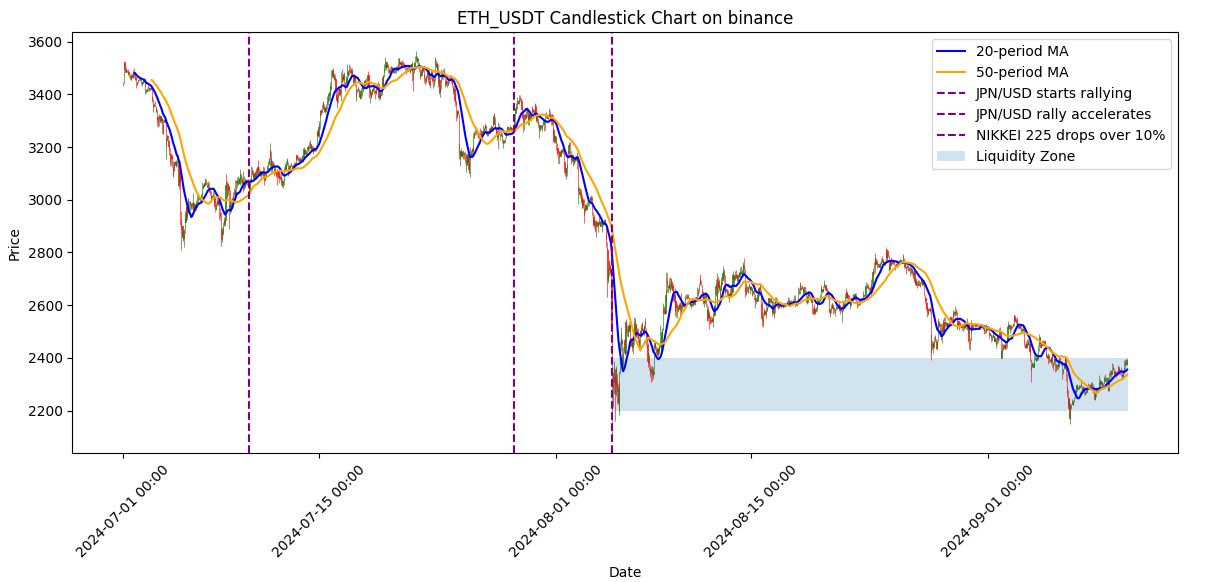
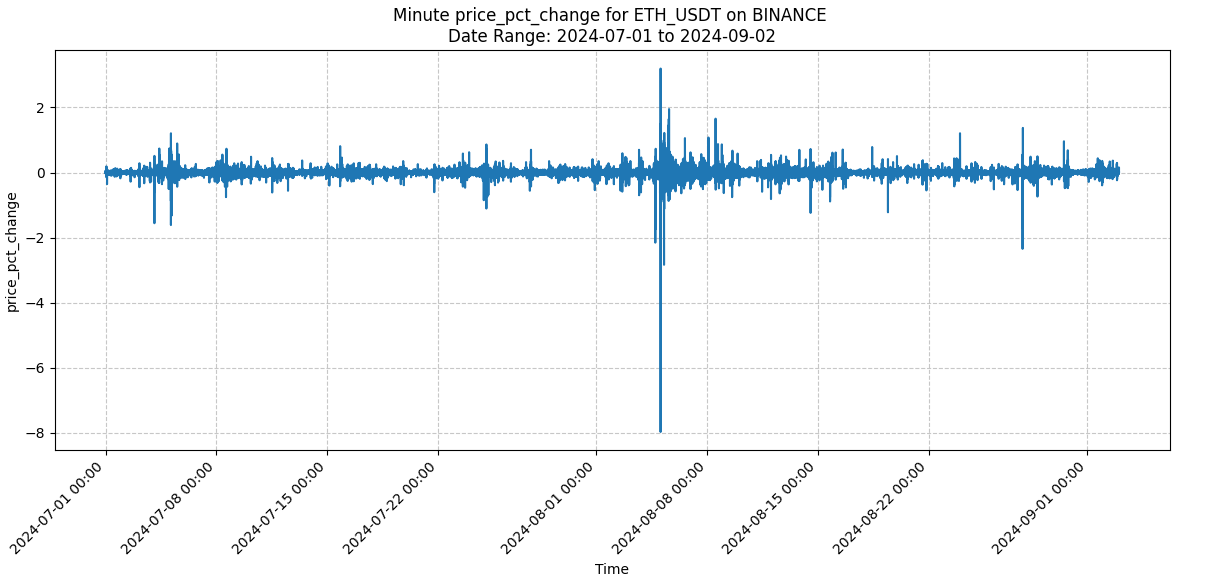
The chart above illustrates the ETH/USDT price action on Binance over a volatile period, marked by key events in the Japanese Yen's appreciation and the impact on global markets, including cryptocurrency. Three major points on this chart highlight how interconnected global traditional financial movements can be with crypto price trends:
- Yen Appreciation Begins (July 10th): The first vertical event line corresponds to the start of the Japanese Yen's appreciation on July 10th. Here, we observe a relatively swift 10-15% increase in ETH/USDT, indicating that the market may have been slow to react to the Yen's early rise. This suggests that, initially, traders and investors were largely unaware of the broader macro changes driving price movements.
- Yen Acceleration (July 29th): A notable acceleration of the Yen's strength occurred on July 29th, coinciding with the first significant drop in ETH/USDT prices. This suggests that the market began factoring in macroeconomic shifts more seriously, triggering sell-offs. From this point, the price fell by another 15%, signalling that the broader market was preparing for further downside.
- Nikkei Drops 10% (August 5th): The most significant price action occurs around August 5th, as the Nikkei 225 dropped by over 10%. At this moment, ETH/USDT experienced large liquidations as the broader market panic spread. Prices plunged quickly before finding support, as highlighted by the liquidity zone between 2200 and 2400, where a consolidation took place, forming a clear range after the price sweep.
To better understand these market dynamics, we will be looking at structural components and behaviours during significant price moves. Observing key metrics before, during, and after such drops can offer a holistic perspective for traders and risk managers.
This can help in:
- Decision-Making: Understanding when and how to react based on unfolding trends.
- Risk Management: Spotting early signs of volatility to mitigate potential losses.
- Identifying Opportunities: Recognizing patterns that repeat during extreme events, thus providing actionable insights.
Key Metrics for Analysing Crypto Market Structure During Volatility
To better understand the price dynamics observed during periods of heightened volatility, this piece will examine a variety of key trading and order book metrics. These indicators provide insights into how participants react to major market moves and how liquidity shifts under stress, offering a comprehensive view of the market structure during extreme events.
From the tradebook (taker side), we will explore:
- Total Traded Volume: Sudden spikes in volume often signal increased market participation, potentially driven by liquidations or aggressive buying/selling.
- Net Trading Pressure: This shows the balance of buy and sell pressure, highlighting which side is dominant during market drops or rallies.
- Trade Count: The number of trades can reveal shifts in participant behaviour, such as increased retail activity or institutional involvement.
- Bid-Ask Spread and Volatility: A widening spread indicates reduced liquidity, making trades harder to execute efficiently and increasing slippage.
- Liquidity-Weighted Price vs. Volume-Weighted Price: Comparing these can expose imbalances in liquidity and trading activity, often leading to higher volatility.
From the order book (maker side), we will focus on:
- Order Book Depth (1% and 5%): This measures available liquidity near the current price, often showing sharp declines during volatile periods.
- Liquidity Fragmentation: Thinly spread liquidity across various price levels can signal a higher risk of price swings.
- Order Book Pressure: Imbalances between buy and sell orders often signal market direction, with high sell-side pressure preceding drops.
- Order Book RSI: This metric helps identify overbought or oversold conditions within the order book, indicating potential reversals.
- Order Book Turnover Rate: High turnover indicates rapid changes in the order book, often correlating with increased market volatility.
- Price Impact/Slippage: Measures how much the market moves in response to trades, with high slippage showing low liquidity and difficulty executing large orders efficiently.
These metrics will help identify patterns in market behavior, liquidity stress, and potential turning points during times of market turbulence.
Total Traded Volume
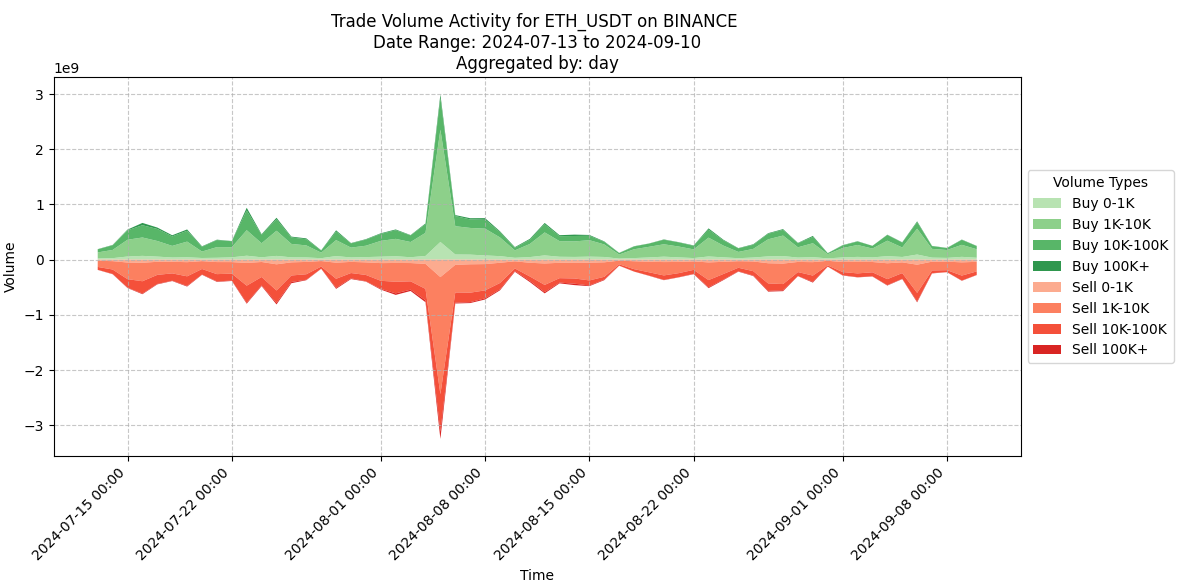
Total traded volume measures the total number of assets traded within a specific time frame, summing up all buy and sell transactions. It is calculated by adding all executed trades during the chosen period, and is typically represented as a bar chart or cumulative total.
This metric is crucial because it reveals market activity and liquidity. Higher volume shows stronger interest and participation, indicating more volatility and bigger price swings. Conversely, lower volume suggests weaker market engagement. Volume also acts as a confirmation tool for price movements: when prices change on high volume, the move is considered more reliable due to broad market involvement. Spikes in volume can indicate shifts in sentiment or impending volatility.
For example, during the recent price drop, total traded volume spiked to $8 billion, compared to the usual $2-4 billion daily range. This surge in activity, particularly in the 1-10k order range, shows increased fear or opportunity-driven trading. As the chart below highlights, this volume spike correlates with sharp price movements, giving insight into market sentiment.
However, volume can be misleading if distorted by off-peak hours or large, one-off trades. A single large trade can cause a spike without reflecting broader sentiment, and isolated volume increases may not always signal sustained market moves. It’s essential to look at whether volume spikes are consistent and aligned with other factors like price action.
After the initial spike, average daily volume dropped to $1-1.5 billion, a 20% reduction from normal levels, suggesting that the market dried up in the aftermath of the price drop.
To get a clearer understanding, traders often pair volume analysis with metrics like VWAP (volume-weighted average price), which shows the average price relative to trade volume, and the bid-ask spread. When volume spikes are accompanied by widening spreads, it can signal market stress and liquidity challenges.
Net Trading Pressure
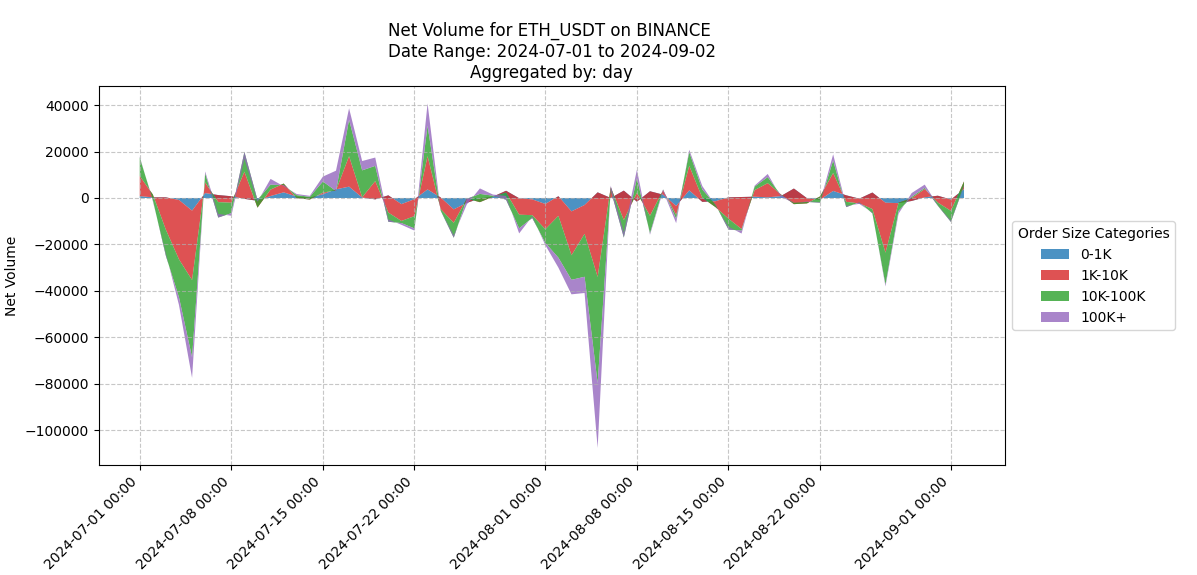
Net trading pressure measures the difference between buying and selling volume, providing insight into which side of the market is dominating. It’s calculated by subtracting total selling volume from buying volume and can be broken down by trade size. This breakdown helps identify which participants are driving the market — retail, institutions, or larger players.
Net buying pressure is particularly useful for gauging sentiment and understanding who’s behind significant moves. Mid-size trades (1-10k and 10-100k) often move first, and watching these sizes can give early signs of market direction. These trades likely represent more informed participants or institutions that face fewer liquidity constraints compared to larger orders. The 10-100k range, for example, typically represents 50-60% of total volume, making it a key category to watch for shifts in sentiment.
Larger trades (+100k) tend to appear only during extreme moves, and while they’re less frequent, they can be used as confirmation of strong market trends. These larger trades, often executed by institutions or whales, typically show up when the market is facing significant pressure.
Divergences between different trade sizes are important. For example, if mid-size trades are showing strong buying pressure but large trades are still selling off, this could indicate a temporary move before a larger trend shift. Pairing this metric with order flow data can provide a fuller picture of market dynamics and help spot shifts before they fully materialise.
Trade Frequency and Count
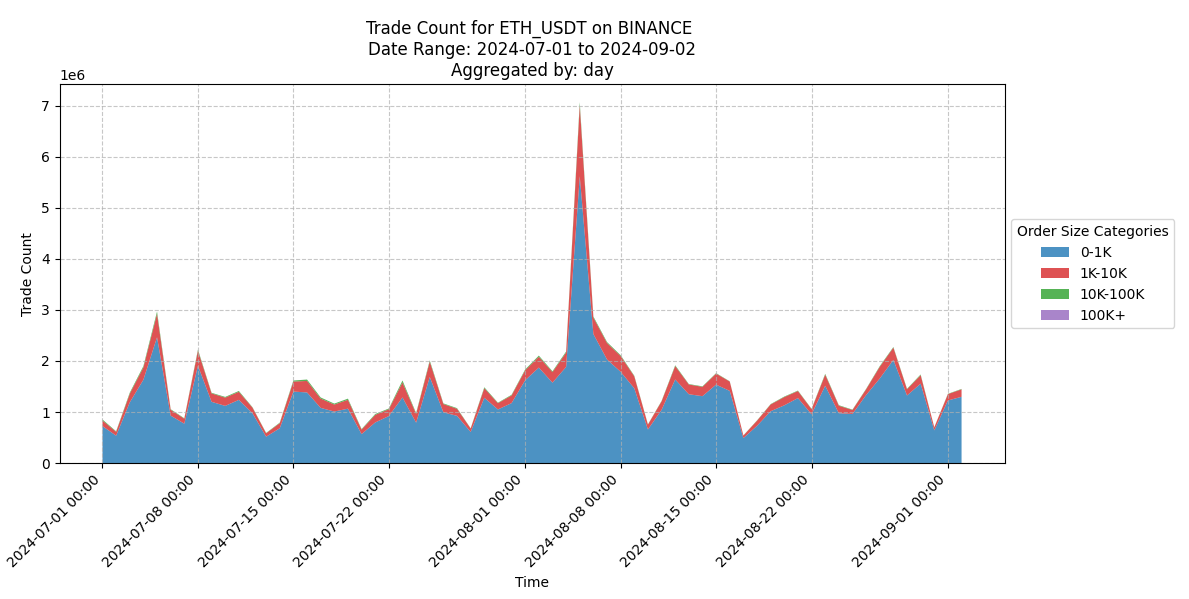
Trade count tracks the number of individual trades executed over a specific period and can provide valuable insight into market dynamics, especially during volatile phases. When trade count spikes, particularly with smaller orders, it often indicates increased bot or algorithmic trading. Bots are frequently triggered by technical indicators, such as moving average crossovers, and can flood the market with small, frequent trades.
During the recent volatility, trade count surged to 7 million trades per minute compared to the usual 1.5 million. This sharp increase, dominated by smaller orders, suggests that bots were highly active, responding to technical setups or momentum shifts. Even though these trades are smaller, the high frequency can cause significant price movements, especially if the order book is thin and liquidity is limited.
Algo-driven trading can have a strong impact on price, as these bots quickly process and execute orders, sometimes overwhelming the market. This creates volatility, as rapid-fire trades hit both buy and sell sides of the order book. In the days following these spikes, trade count often drops sharply, signalling a reduction in bot activity and a return to more stable market conditions.
Bid-Ask Spread and Volatility
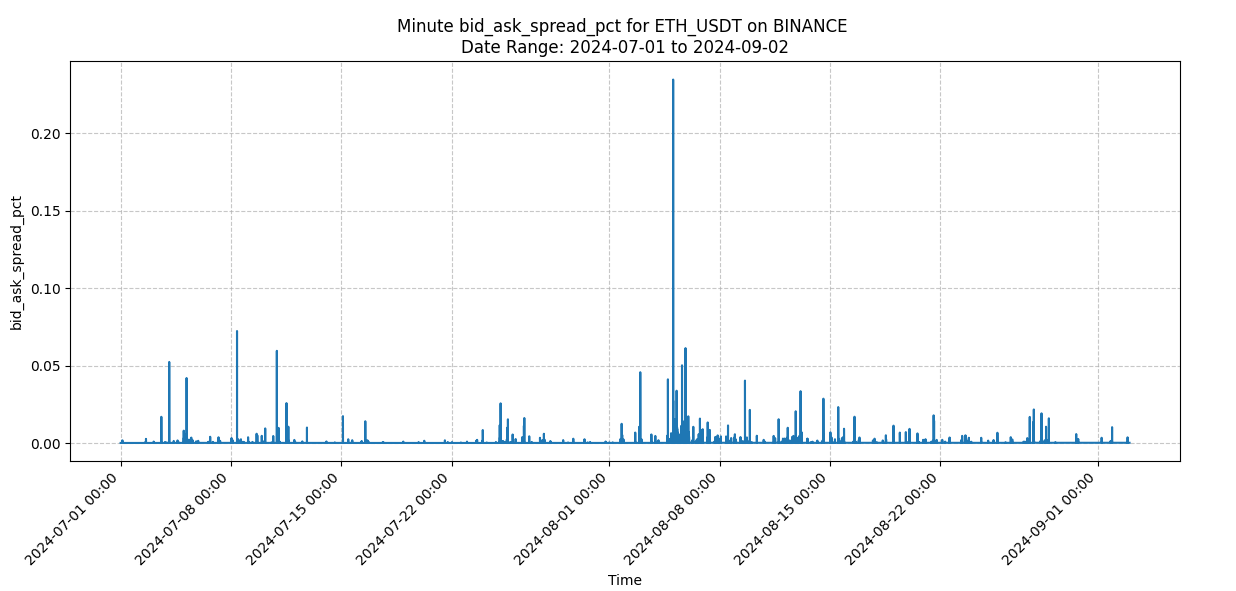
During periods of heightened volatility, like the recent price drop, we observe price volatility clustering, where sharp price changes persist over time. This coincides with a significant widening of the bid-ask spread, which jumped to over 0.2% during the drop and remained elevated for several days afterward. This persistent spread widening indicates increased execution costs as market participants pull liquidity and become more risk-averse.
This spread expansion poses challenges for trading strategies, particularly those reliant on tight execution. The larger the spread, the more traders must pay to enter or exit positions, increasing slippage and reducing profitability. For high-frequency and algorithmic traders, the costs associated with this spread widening can significantly impact performance, forcing them to adjust strategies in response to the new conditions.
By comparing the average volatility and bid-ask spreads before and after the event, we can clearly see the stress levels in the market. The sustained elevated spreads after the price drop reflect the ongoing difficulty in executing trades efficiently, with increased costs persisting even as the market begins to consolidate. Traders need to account for these higher execution costs following large events, as spreads may take time to normalise.
Liquidity-Weighted Price vs. Volume-Weighted Price
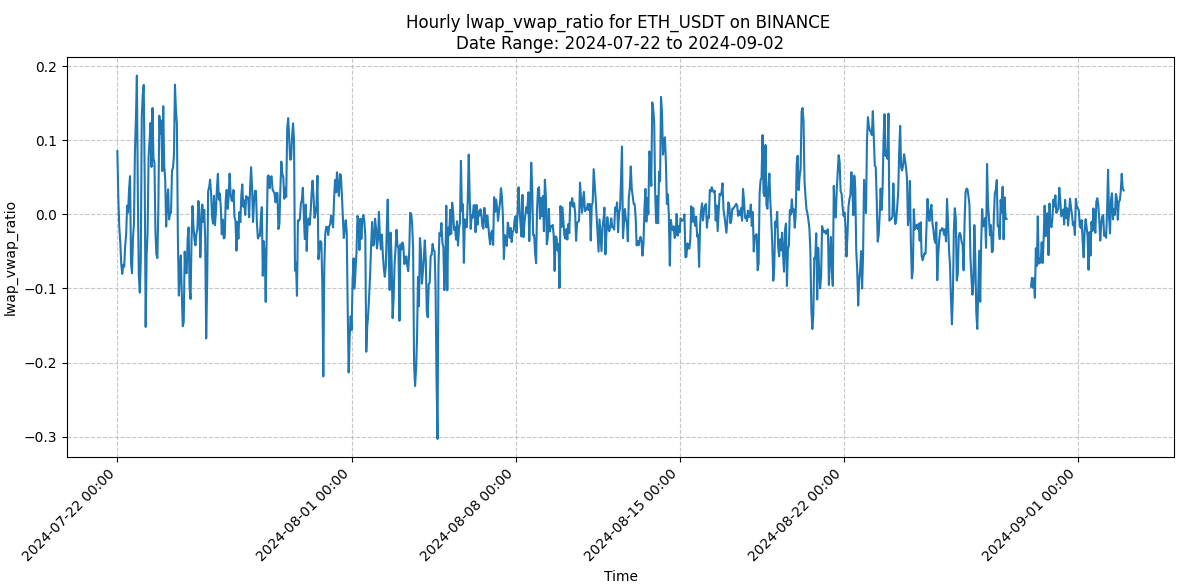
LWAP (Liquidity-Weighted Average Price) and VWAP (Volume-Weighted Average Price) are important metrics that offer insights into market conditions. LWAP is derived from the order book, focusing on the price based on liquidity at various price levels, while VWAP comes from the trade book, representing the average price based on the volume of executed trades over time.
The difference between LWAP and VWAP helps reveal market sentiment. If LWAP is lower than VWAP, it suggests that liquidity is concentrated on the sell side, meaning sellers may be dominating and creating potential downward pressure. Conversely, when LWAP is higher than VWAP, it indicates stronger buy-side liquidity, signalling bullish sentiment.
Before the August 5th drop, the difference between LWAP and VWAP dropped sharply to -0.3, indicating significant sell-side pressure. This suggested that while trade volumes remained steady, there was a growing imbalance in the order book, with sell-side liquidity outweighing buy-side liquidity. This shift was a potential early warning sign of the coming market decline, as the negative difference indicated weakening market conditions.
Tracking the trend of LWAP vs. VWAP over time can help traders identify potential market turns. Large drops in this difference, especially to negative values, can indicate building sell pressure, signalling a possible downturn. By monitoring this relationship, traders can better anticipate shifts in market sentiment and prepare for major price moves.
Volume of the Order Book at 1% and 5% Depth
The 1% and 5% depth profiles provide key insights into the structure of the order book and the available liquidity at different price levels. By examining how much buy and sell liquidity exists within 1% and 5% of the current market price, traders can understand how liquidity is distributed and how this affects market behaviour during volatile events.
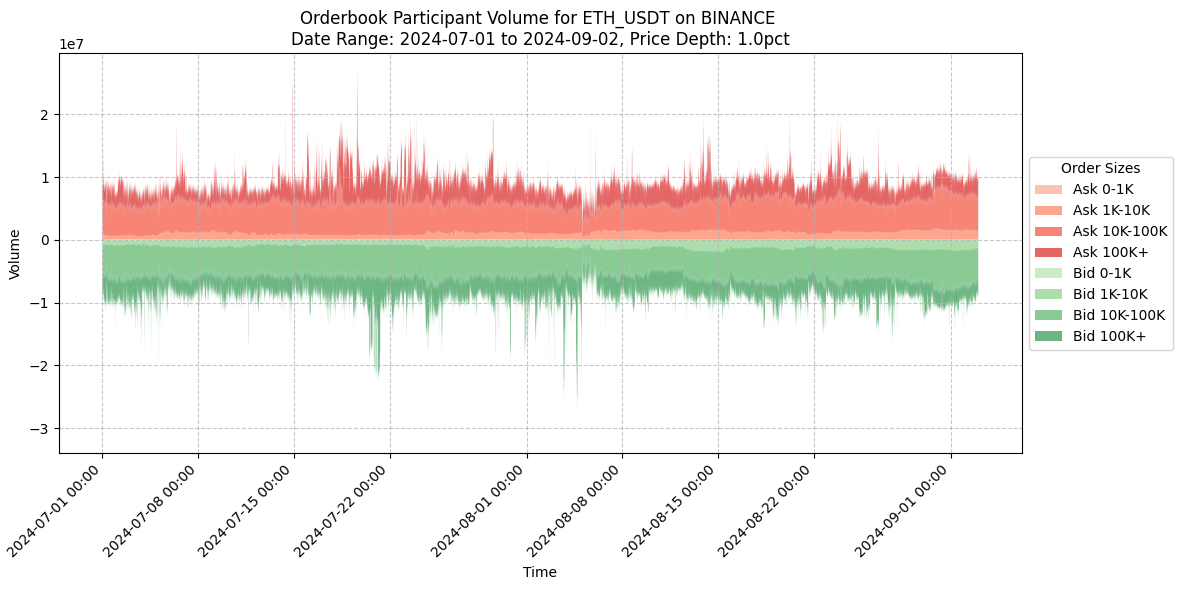
The 1% depth chart focuses on liquidity closer to the market price, often showing how tightly liquidity is concentrated. For example, around recent market drops, the 1% depth profile revealed significant changes in liquidity, with a noticeable tightening as liquidity thinned by 20-30% following the event. This reduction in near-market liquidity made executing trades more expensive and difficult, contributing to short-term volatility as prices became more sensitive to smaller orders.
In contrast, the 5% depth chart provides a broader view of the order book. During the market drop, this deeper level showed a spike in bid volume, indicating strong buying interest below the market price. This suggests that some traders anticipated a potential bounce or saw lower prices as attractive entry points. The increased liquidity at the 5% depth helped stabilise the market after the initial drop, showing that while near-market liquidity thinned, there was strong interest at lower levels.
The comparison between 1% and 5% depths highlights the importance of examining liquidity at multiple levels. While the 1% depth shows near-term price sensitivity and immediate market reactions, the 5% depth reveals longer-term support and the willingness of participants to place orders at deeper price levels. This divergence in liquidity distribution reflects varying trader expectations and risk appetites, with some seeking short-term opportunities and others positioning for potential reversals.
Monitoring both the 1% and 5% depth profiles provides a comprehensive view of market structure. It helps traders anticipate liquidity-driven price swings, understand the likelihood of support or resistance at different levels, and adjust their strategies accordingly during periods of high volatility.
Liquidity Fragmentation Profile at 0.25% Depths
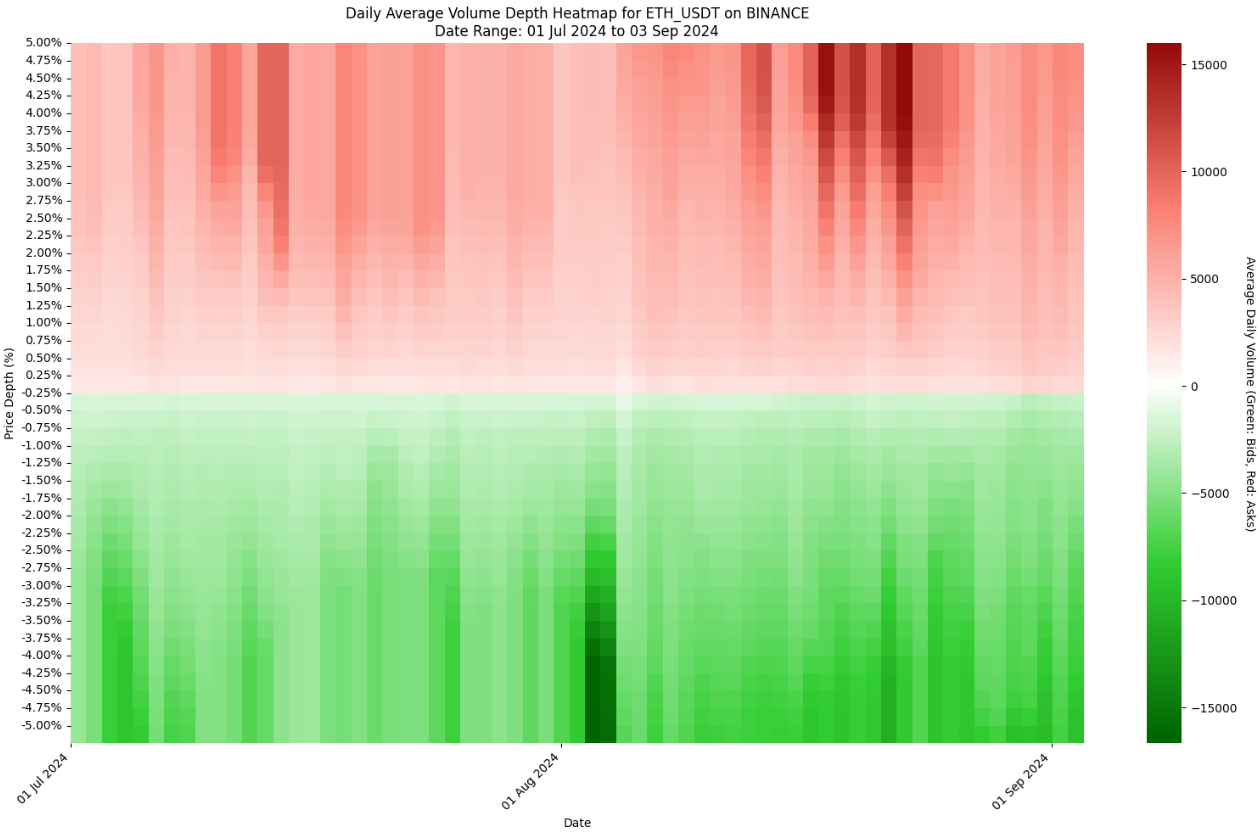
The liquidity fragmentation profile at 0.25% depths measures how liquidity is distributed across narrow price levels within the order book, offering insight into market structure and sentiment. This profile tracks how much buy and sell liquidity exists within 0.25% of the current market price, providing a detailed view of how liquidity is concentrated or fragmented around key price points.
Using a heatmap, this metric visually represents changes in the order book over time by normalising the percentage differences from the mid-point. The heatmap allows traders to track how liquidity evolves, showing periods of increased or decreased liquidity at specific price levels. For example, in early August, a dark band on the heatmap indicated a significant increase in liquidity close to the mid-point, suggesting that participants were actively placing orders around key price levels as prices shifted. These periods of deep liquidity often point to important support or resistance zones in the market.
While depth charts give snapshots of liquidity at fixed price ranges like 1% or 5%, the liquidity fragmentation profile offers a more granular, real-time view of how liquidity is spread across smaller intervals. This helps traders understand the broader picture of how market sentiment is shifting and which price levels are being tested by large amounts of liquidity.
Analysing this profile provides insights into potential price support and resistance levels. When liquidity is heavily concentrated at certain depths, it can act as a barrier to price movement. On the other hand, fragmented liquidity may indicate weaker support or resistance, increasing the likelihood of price swings. By tracking the changes in liquidity over time, traders can anticipate potential market movements and identify critical levels where sentiment may shift.
Pay close attention to periods where deep liquidity is tested or fragmented, as these often align with significant market events. This can help better time entries and exits and understand where price might find support or face resistance.
Read the full report here as this is just the subset of the report. The rest of the report will include order book pressure, order book RSI, order book turnover rate, price impact/slippage, and then we conclude with final thoughts!
Disclaimers
The information contained in this report is provided by Amberdata solely for educational and informational purposes. The contents of this report should not be construed as financial, investment, legal, tax, or any other form of professional advice. Amberdata does not provide personalized recommendations; any opinions or suggestions expressed in this report are for general informational purposes only.
Although Amberdata has made every effort to ensure the accuracy and completeness of the information provided, it cannot be held responsible for any errors, omissions, inaccuracies, or outdated information. Market conditions, regulations, and laws are subject to change, and readers should perform their own research and consult with a qualified professional before making any financial decisions or taking any actions based on the information provided in this report.
Past performance is not indicative of future results, and any investments discussed or mentioned in this report may not be suitable for all individuals or circumstances. Investing involves risks, and the value of investments can go up or down. Amberdata disclaims any liability for any loss or damage that may arise from the use of, or reliance on, the information contained in this report.
By accessing and using the information provided in this report, you agree to indemnify and hold harmless Amberdata, its affiliates, and their respective officers, directors, employees, and agents from and against any and all claims, losses, liabilities, damages, or expenses (including reasonable attorney’s fees) arising from your use of or reliance on the information contained herein.
Copyright © 2024 Amberdata. All rights reserved.
