Share this blog:
“Trading on margin” refers to borrowing funds from an exchange to trade bigger. You put up a certain amount of cash as collateral and borrow the rest. The reason for trading on margin is that you can dramatically increase your profits. Of course, the converse is also true—you're dramatically increasing your risk, too.
If the market goes your way, great. If it doesn’t, you may have to put up more collateral. If you don’t or can’t put up more, the exchange is empowered to liquidate your position, causing you to lose your entire collateral, and possibly owing more money to the exchange.
The initial amount of cash you put up is called “initial margin.” The amount, or percentage, you must keep in the account is called your “maintenance margin” or “margin requirement.” You can trade spot crypto in a margin account, and futures, options, and swaps are typically traded on margin.
There are two types of liquidation: partial and total. Your position can be partially liquidated if a partial sell off will reduce your exposure enough to get you back within the parameters of your margin requirement. Total liquidation is just what it sounds like—your position is forcibly closed to prevent further losses and you are, in the parlance, “rekt.” If you’re new to crypto trading, “rekt” means “wrecked.” If you or your position got rekt, it means you took heavy losses.
One way to keep from getting rekt is to keep an eye on crypto liquidations data. As is often the case in life, one person’s loss is another’s gain. And so it can be with crypto liquidations data; this data can provide indications of where a market is going, essentially giving you the opportunity to profit from the missteps of others. By analyzing crypto liquidations data, you can identify support and resistance, entry and exit points, and get a feel for market sentiment.
Where can you find crypto liquidations data?
Amberdata’s crypto market data API includes real-time and historical liquidation data. Our liquidation endpoints for futures, options, and swaps are available via REST API for historical (time series) data as well as WebSockets for real-time data. Our crypto liquidations data is available by assets as well as exchanges. For an example of what we offer at the exchange level, see our Binance liquidation data.
For each of the markets listed below, we’ve listed the API endpoints needed to return both real-time and historical crypto liquidations data, as well as the exchanges covered for each.
Futures
API endpoints
- /market/futures/liquidations/{instrument}/latest
- /market/futures/liquidations/{instrument}/historical
Options
API Endpoints
- /market/options/liquidations/{instrument}/latest
- /market/options/liquidations/{instrument}/historical
Swaps
API Endpoints
Using liquidation data for research
Predicting market movements/trends with liquidation data analysis is something many successful traders do. By analyzing liquidation data, you can gauge market sentiment and identify potential support and resistance levels. Large liquidations can lead to big market moves and increased volatility. Also, you can use crypto liquidation data to develop trading strategies that capitalize on market movements caused by liquidations. For example, looking for entries or exits when a large number of liquidations occur, anticipating market reaction.
If you’d like some more ideas, our Liquidations on Perpetual Futures Contracts Report will give you some.
Indicators to watch in crypto liquidations data
When analyzing liquidation data, keep these helpful indicators in mind:
- Liquidation Levels: These are the levels pre-determined by the exchange at which your position will be liquidated. For instance, if your exchange’s liquidation level is 10 percent, and your margin drops to 9.99 percent, your position will be liquidated. Knowing the levels helps you avoid getting a margin call or liquidation.
- Dollar Cost Averaging (DCA) Liquidation Calculation: A DCA Liquidation Calculation is a tool used by traders/investors who employ a DCA strategy, to help them avoid being liquidated. It calculates and displays the liquidation price for each portfolio position.
- Liquidation Ranges and Volume/Open Interest Dots: Liquidation ranges and Volume and Open Interest data give you insight into spots in the market where liquidations are being triggered. Forced activity often provides opportunities for the nimble trader. It can be like walking into a store just as a fire sale begins.
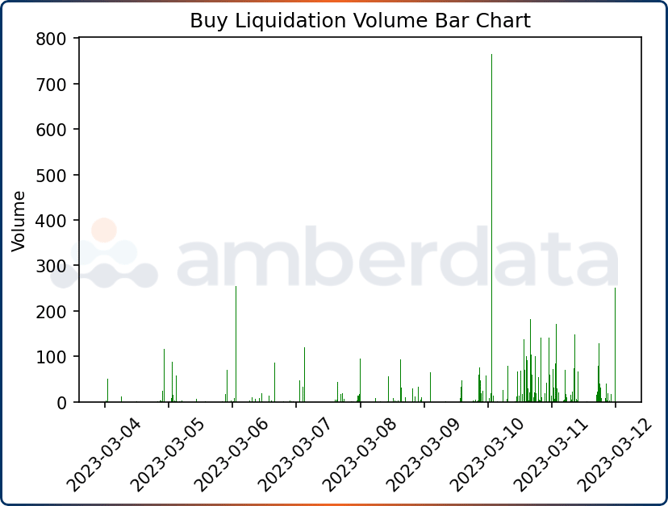
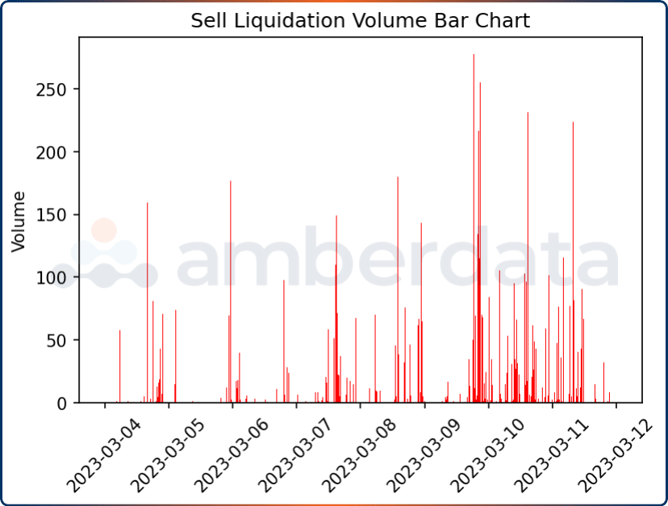
- Long/Short Liquidations: Long/Short liquidation data can give you a useful signal as to the strength or weakness in the market.
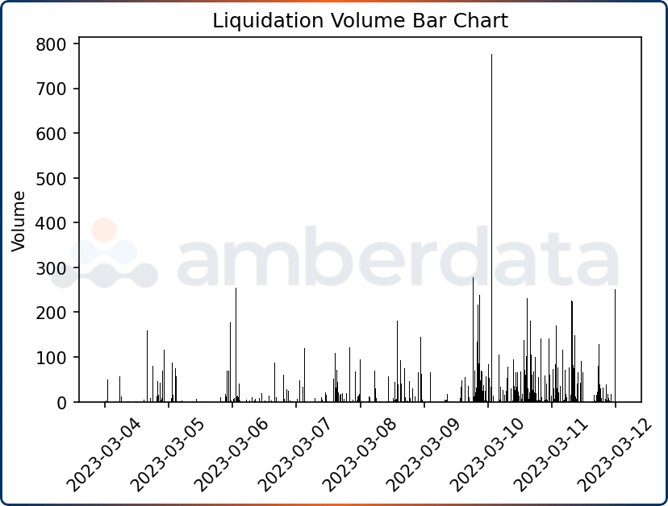
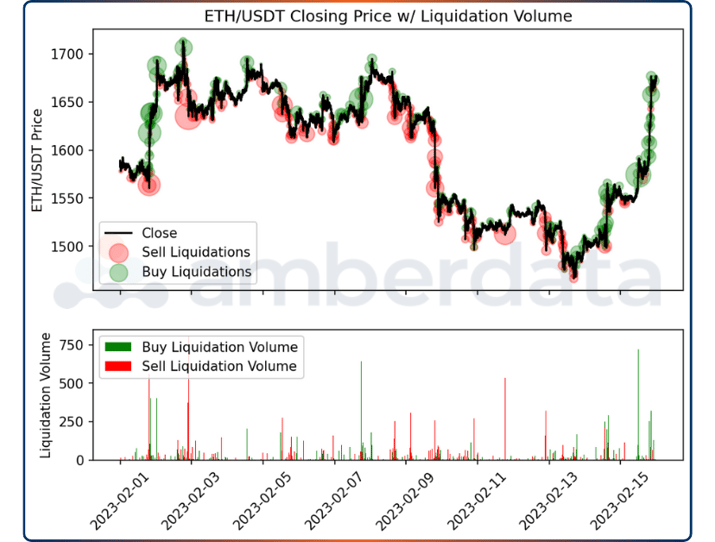
Creating crypto liquidation charts and heatmaps
Crypto market data can be voluminous and complex. Visual representation of complicated data allows for easier comprehension, faster decision-making, and improved communication of information. Visuals are more engaging and easier to understand than blocks of text or tables of numbers. As such, creating charts, heatmaps, dashboards, and other types of visualizations can help you quickly digest and understand market data.
A well-designed chart or graph can show relationships between multiple data sets, trends over time, or comparisons between different categories of data. For instance, a line chart can display how a crypto’s price has changed over the past year, or a bar chart could compare the performance of different positions in your portfolio.
Dashboards, which aggregate multiple visualizations in one place, are particularly useful for providing a comprehensive overview of data from different sources. They can include data of all sorts with varying date ranges to help you think about what happened, why it happened, what may happen, and how you can profit from that. Moreover, you can customize your visualizations to show exactly the info that you think is important, or which has helped you in the past.
Amberdata’s liquidations data API endpoints provide the raw data you need to create these visual trading tools.
Crypto Liquidation Data is a must
Crypto liquidations data can in many ways help make you a better trader, or at least a better informed one. Whether it’s liquidations of futures, options, or swaps, helping you find profitable, low-risk entries, or simply helping you avoid your own liquidations, we have the data to help you.
Amberdata was built to serve institutional traders. We provide solutions and expertise for every digital asset class participant. Whether you’re a financial institution just entering the asset class, a seasoned crypto trader, or a Fintech building or enhancing products, Amberdata has digital asset data solutions to meet your needs.
Along with providing comprehensive, granular, and normalized data, we help you stay informed of activity in the crypto markets with our research and commentary each month in our blogs, resource library, guides and primers, as well as insights into blockchain networks, crypto markets, and decentralized finance.
Explore Amberdata’s liquidation data endpoints in our API docs.
