Share this blog:
Introduction to Perpetual Futures Contracts
One of the most common financial instruments in cryptocurrency markets is the perpetual
futures contract. In cryptocurrency markets, perpetual futures contracts are a type of derivative instrument that allows traders to speculate on the future price of underlying cryptocurrencies.
Contrary to traditional futures contracts with a fixed expiration date, perpetual contracts don’t have a fixed expiration date (hence the name “perpetual”). Additionally, perpetual futures markets offer a unique key difference that traditional spot markets don’t offer: leverage. Many market participants prefer to trade perpetual contracts with leverage rather than spot markets. However, with the advantage of leverage comes the additional risk of liquidation.
Liquidation on perpetual futures contracts occurs when the trader’s position reaches a certain loss
level, depicted as the trader’s required “maintenance margin”. A maintenance margin exists to protect exchanges and brokers from incurring losses during periods of high market volatility. For example, if a cryptocurrency trader buys an ETH/USDT perpetual futures contract, and the price of ETH/USDT goes down substantially after the trader opens their position, the trader might receive a maintenance margin call. Also, each exchange and broker has unique minimum margin requirements. In this scenario, the exchange or broker will request the trader to deposit more funds into the account to meet the minimum margin requirements. If the trader fails to deposit more funds into the account, the exchange or broker may liquidate (sell) the trader’s long position at the market price. As a result, the trader will realize a loss equal to the original cost of the position and the sale price at liquidation.
Liquidations play a significant role in cryptocurrency markets. Primarily, liquidation events provide valuable insights regarding potential short-term market moves particularly because of the influx of order flow. By parsing liquidation data, traders can determine various factors such as magnitude and frequency to make a trade decision. Additionally, liquidation data could be a leading indicator for market condition changes and gauging trader risk appetite.
Visualizing Liquidation Data Volume for Perpetual Contracts
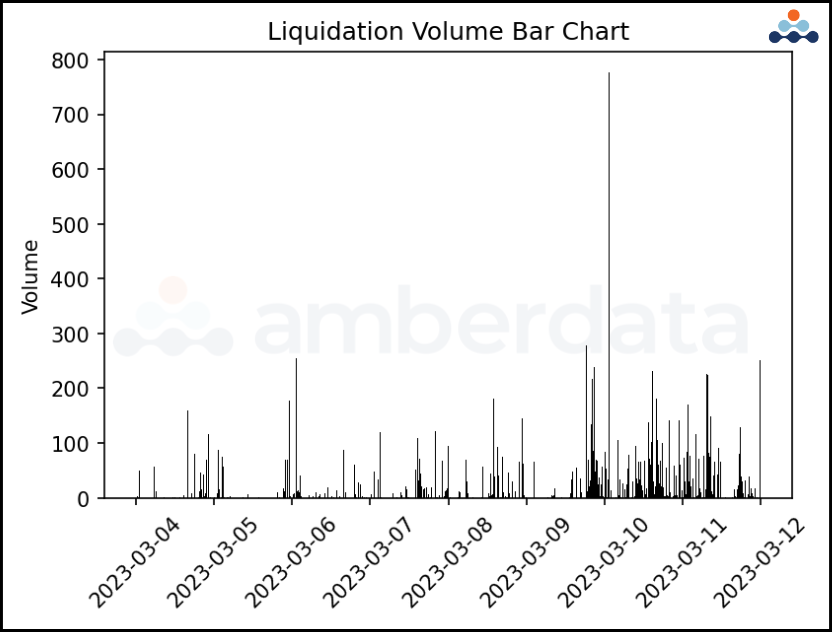
Here is a basic example of liquidation volume for long and short orders on ETH/USDT perpetual
contracts on Binance. The ETH/USDT pair was chosen for this research because of its high liquidity, volatility, popularity, and accessibility amongst most perpetual futures market participants. Similar to traditional volume bars, liquidation volume charts can be used to visualize changes in liquidations over time. The chart above displays the amount of ETH/USDT liquidated on the y-axis against the x-axis, which depicts time on a 1-minute interval. It’s important to note that the liquidation data was modified from its original format. Considering that liquidations occur on a tick-by-tick basis, meaning that there can be many liquidations within a specific timeframe, the liquidation data is aggregated into groups for each minute. In this case, liquidation data functions like volume bars, where data is pooled into groups. Rather than keeping the original raw data, it’s common practice to group time series data into time-allocated groups to overlap additional data, such as OHLCV candlestick data.
Parsing Long/Short Liquidation Volumes
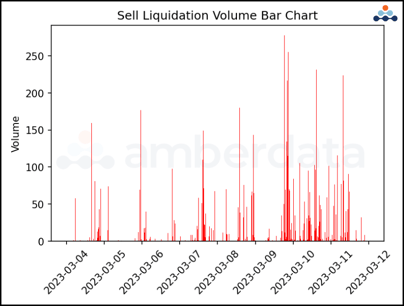
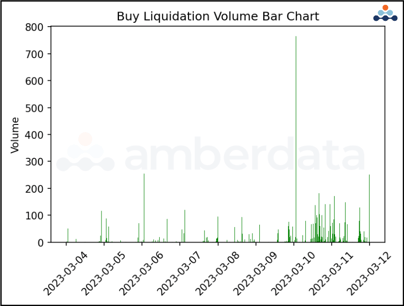
In these liquidation volume plots, the liquidation volume is parsed via long and short liquidation volume. Long liquidation volume occurs when a market participant’s short position is liquidated (buy market order) whereas short liquidation volume occurs when a market participant’s long position is liquidated (sell market order). By parsing the data into separate long and short orders, changes in liquidation order flow during different market conditions can be visualized. Generally speaking, the assumption is that high liquidation volumes occur during periods of high market volatility because of the nature of forced liquidations. When the market price rapidly moves against a trader, hence price volatility, the exchange or broker may close their position.
Visualizing Liquidation Data Against Trends
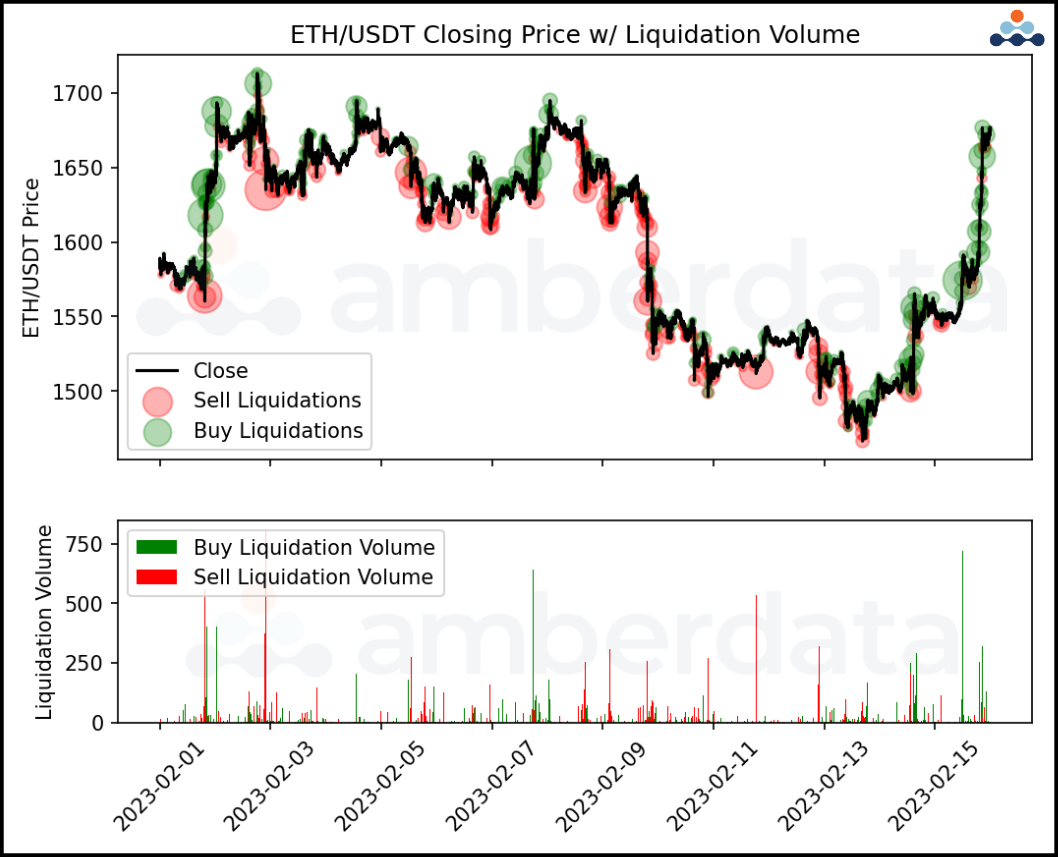
In this liquidation plot, spot ETH/USDT closing price data on 1-minute granularity is plotted on
the upper subplot. Within the upper subplot is a scatter plot with liquidation values appended to the closing prices of ETH/USDT. The “bubbles” within the upper subplot vary in size based on the size of a buy or sell liquidation for each 1-minute closing price. On the bottom subplot, buy and sell liquidation volumes are combined into an individual subplot to supplement price trends in the upper subplot. The purpose of these subplots is to visually identify liquidation trends in response to changes in underlying spot market price trends. One of the main takeaways from the subplots is how trends tend to continue when liquidations occur. Of course, many of these liquidations are noise in the big picture, but the trend in continuous liquidations likely occurs of changes in market psychology. When a significant amount of assets are liquidated, it can generate panic and doubt among market participants, leading them to sell their holdings and contributing to higher market instability, thereby resulting in further liquidations.
Synthetic Trading System Return Distributions
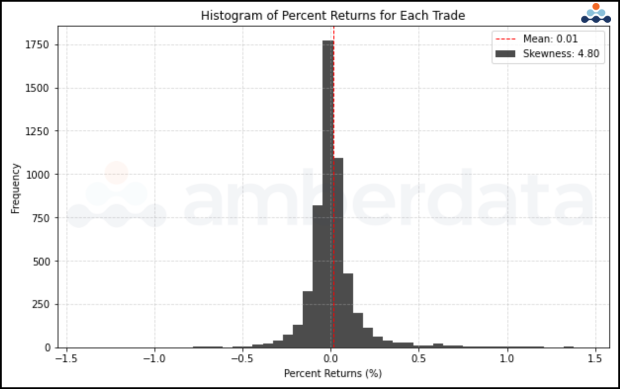
This histogram plots the percent returns for each synthetic trade on ETH/USDT in 2023. The
percent returns, as listed on the x-axis, are calculated by dividing the difference between the selling price and the buy price by the by price times 100. The trade components are fairly simple. To test whether liquidation data influences future returns in ETH/USDT, the trading system buys ETH/USDT when long liquidation volume (on a 1-minute interval) is greater than 0. The system closes the position when long liquidation volume is 0. The returns for this trading system can be visualized in the first histogram above. Without accounting for commissions, to see whether predictability potentially exists, the mean return for the system on a 1-minute interval was 0.01%. Additionally, the skewness of the distribution for the first plot is 4.80, which represents that returns are extremely skewed to the positive side. However, most of the percent returns that distribute the skew are outliers, rather than returns close to the mean.
It’s important to consider that the returns of this trading system will not yield profitable results
when traded in reality, given the small granularity and heightened trade frequency. With the traditional basic assumption that each trade costs roughly 0.2% in commission, a 0.01% profit per trade is not enough to cover the cost. For further research, the trading system should incorporate additional factors to reduce noise and trade frequency.
Conclusion
Perpetual futures contracts have become a popular financial instrument in cryptocurrency
markets. With the advantage of leverage, traders can speculate on the future prices of underlying cryptocurrencies. However, the added risk of liquidation events is a crucial aspect of perpetual futures contracts.
Liquidation events happen when the trader's positions reach a certain loss level, and if the trader fails to meet the minimum margin requirements, their position may be liquidated. Analyzing liquidation data can provide valuable insights into potential short-term market moves, and serve as a leading indicator for market condition changes.
The study of liquidation volume plotted for ETH/USDT perpetual futures contracts on Binance demonstrated that high liquidation volumes tend to occur during periods of high market volatility. During high volatility periods, traders could potentially use liquidation data to forecast short-term direction. However, the results of trading liquidation data on a 1-minute frequency are not necessarily profitable given the small granularity and heightened trade frequency. Further research is necessary to incorporate additional factors to reduce noise and trade frequency to make the results more reliable.
Further research could incorporate additional data such as the effect of different margin levels on liquidation effects, the impact of volatility during liquidation events, and how and how unique currency pairs react to liquidation events.
To download the full report, click here.
