Share this blog:
Understanding the volatility term structure is key to identifying market shifts and adjusting trading strategies accordingly. By analyzing slope and curvature changes, traders can anticipate regime shifts, optimize position durations, and refine hedging techniques—enhancing their ability to navigate the dynamic crypto options landscape. Learn more in this week's overview:
Introduction
In the options market, implied volatility varies across different maturities. When traders chart these values, they generate a volatility term structure, showing how implied volatility changes from near-term expirations to longer-dated ones. A steeply sloped term structure often indicates that the market anticipates more price turbulence in the near future. Conversely, a flatter or inverted curve could reveal that the perceived risk is more elevated for further-out expiries.
Analyzing these shifts is more nuanced than just looking at spot prices or volume data. It involves detecting subtle patterns in how implied volatility is priced for short-term vs. long-term options and how that pricing evolves. While short-term blips can reflect reaction to immediate events, a deeper structural change—such as a flattening curve that lasts for several weeks—can signal a more enduring regime shift. In crypto trading, capturing these signals is invaluable because it offers a clearer roadmap for portfolio adjustments and timing decisions.
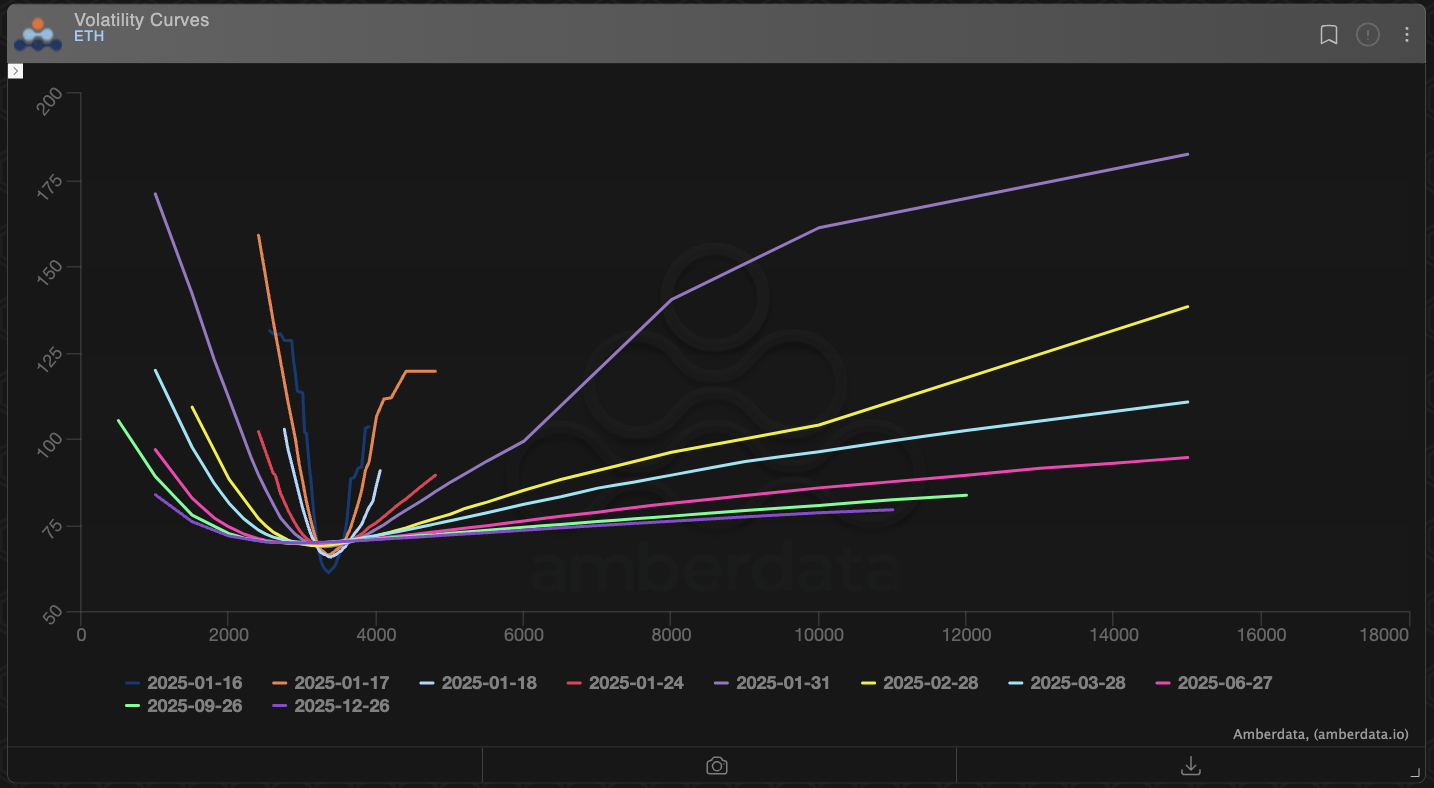
Amberdata’s platform provides granular data on implied volatility for both Bitcoin (BTC) and Ethereum (ETH). Although we’ll reference Volatility Curves for these assets below, the same principles apply to other large-cap cryptos or even traditional assets. The goal is to show how real-time data and historical comparisons can help traders spot the early signs of new market environments.
Monitoring Slope and Curvature in the Volatility Term Structure
Defining the Volatility Term Structure
The volatility term structure maps implied volatility across multiple expirations, forming a curve that can slope upward or downward. If the market forecasts higher near-term risk, shorter maturities might be priced with higher IV, creating a steep upward slope from left (short term) to right (long term). If, on the other hand, the market expects uncertainty to grow further in the future, longer expiries could have higher IV, steepening the curve in the opposite direction.
Crypto markets often experience rapid demand shifts for near-term hedges, especially around macroeconomic announcements or major protocol upgrades. These demand surges can skew the slope dramatically. By continuously monitoring these shifts, traders can detect market anomalies that might warrant quick position adjustments. A flattening slope, for instance, could indicate that traders believe the wave of volatility has already peaked, while a steepening curve implies a broader or more prolonged expectation of price swings.
BTC vs. ETH Comparison
Although correlations between BTC and ETH remain relatively high over longer horizons, the short-term dynamics can diverge significantly. In cross-asset analysis, you might notice that BTC’s short-dated implied volatility rises more sharply than ETH’s during a specific week—perhaps due to Bitcoin-specific headlines. This divergence in slopes could spotlight a trading opportunity: if BTC’s implied volatility has overshot relative to ETH, some traders might adopt strategies to capture that pricing discrepancy.
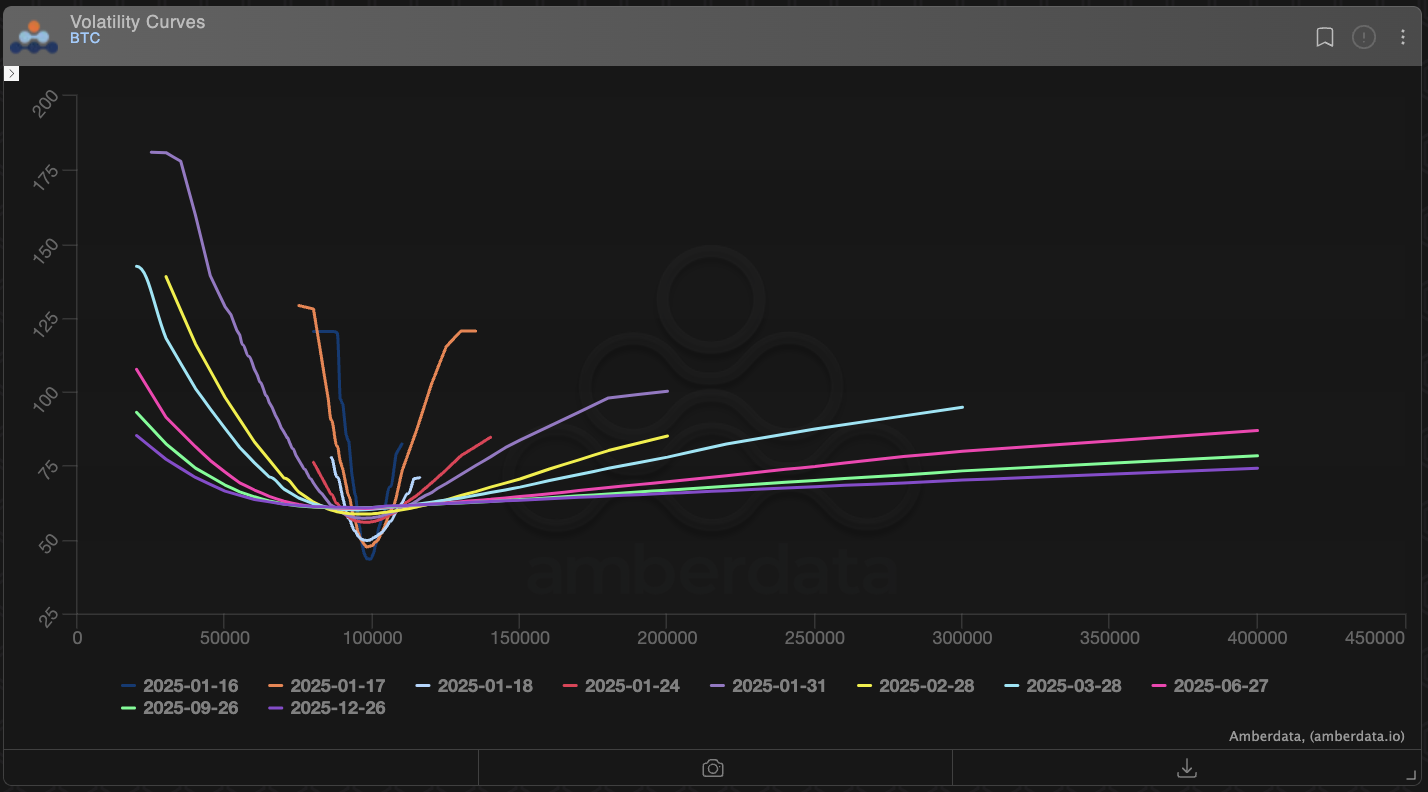
One might also look for a scenario where ETH’s curve flattens while BTC’s remains steep. This mismatch could reflect differing trader sentiment or unique events on one network. In either case, it’s worth dissecting why these differences arise. Such an analysis can supplement your existing knowledge of volatility surfaces and price-volume data, offering a richer context for possible cross-asset analysis.
Identifying Regime Shifts with Term Structure Dynamics
Significance of Curvature Changes
Beyond the slope, the curvature of the volatility term structure also signals potential disruptions. Curvature captures how the middle portion of the curve behaves relative to the edges (short-term vs. long-term). A pronounced dip in mid-maturity implied vol could suggest that the market is anticipating short-term volatility to subside, with uncertainty picking up again in the distant future. If that pattern reverses swiftly, it could mark the onset of a volatility clustering phase, where traders rapidly reevaluate their risk perceptions.
In practice, multiple events can influence the curvature. These include new regulatory statements, unanticipated network forks, or macro-level changes like interest rate announcements. When traders see repeated shifts in the curve’s shape, they often interpret it as a regime change—a shift from tranquil to more volatile markets or vice versa. Amberdata’s real-time analytics let you watch these moves unfold, making it easier to spot the moment a stable environment transitions to turbulence.
Short-Term vs. Long-Term Expectations
A key dynamic in maturity adjustments is balancing short-term vs. long-term horizon risks. If Mark IV (a consolidated measure of implied volatility for near-term expiries) remains anchored while Forward IV (or implied volatility for later expiries) ratchets upward, it suggests the market is more concerned about potential price swings in the months ahead rather than the days to come. Conversely, if short-term IV skyrockets but the back end remains calm, it might reflect an anticipated but brief period of chaos that will settle down quickly.
Regime changes often manifest in these diverging short- and long-term volatilities. Such divergences can push institutional traders to move capital into or out of certain maturities. For example, if short-term volatility is spiking without a corresponding bump in longer maturities, some might interpret that as a short-lived shock—potentially an opportunity to hedge (via shorter-dated puts or calls) and then rotate back into longer maturities if and when the curve normalizes.
Practical Strategies for Traders Using Term Structure Analysis
Position Durations
One of the first decisions when adjusting for new market conditions is position duration. If your analysis indicates a more protracted shift in the volatility term structure, lengthening your exposure might make sense—buying longer-dated options that could gain value if implied volatility remains elevated. Conversely, if a short but intense spike is looming, short-duration trades (like weekly options) can be more fitting.
Spread Strategies and Straddles
For those anticipating bigger price moves but uncertain about direction, straddles—where a trader buys both a call and a put at the same strike—can be an appealing bet on rising volatility. If the slope of the term structure steepens abruptly, short-term straddles may become relatively expensive. Traders who believe the market will remain volatile for an extended period might prefer longer maturities for capturing potential swings.
Spread strategies can also help mitigate the cost of taking a view on future volatility. For instance, if the front of the curve is priced at extremely high IV while the back end appears undervalued, a diagonal spread might capture the difference. You could buy a near-term option and sell a longer-term one—or vice versa—depending on the expected path of volatility. Each approach attempts to exploit the pricing mismatch revealed by the real-time term structure analysis.
Hedging Techniques
As volatility regimes evolve, so should your hedging framework. If you’re used to rebalancing once a week but see the short end of the curve fluctuating daily, it may be wise to update hedges more frequently or switch to instruments that automatically adjust. Tools like dynamic delta-hedging—discussed in detail in our piece on hedging—can maintain more stable risk exposure during high-volatility stretches.
Amberdata’s continuous feeds of implied volatility data let you see second-by-second shifts in the curve. That immediacy can be indispensable for traders who need to pivot quickly—particularly in the crypto ecosystem, where trading runs 24/7.
Conclusion
Recognizing shifts in the volatility term structure can be a game-changer for institutional traders looking to anticipate market turbulence or settle into calmer waters. By examining the slope and curvature across different expirations, it becomes possible to detect early signs of regime changes—not merely as ephemeral “noise,” but as meaningful indicators of shifting market psychology.
Whether the market is entering a phase of volatility clustering or edging toward stability, adjusting one’s strategy in tandem is crucial. This might mean reevaluating position durations, embracing spread strategies that exploit term structure anomalies, or altering hedging practices to match new risks on the horizon. The synergy of short-term vs. long-term volatility readings offers richer insights than any single snapshot could provide.
While we highlighted the Volatility Curves for BTC and ETH, the same principles extend to any asset class with liquid options. Furthermore, combining term structure analysis with our crypto options know-how ensures traders are well-prepared to maneuver a constantly evolving market environment. Ultimately, staying vigilant in monitoring these shifts—and acting decisively when patterns suggest a move from calm seas to raging waves (or vice versa)—can set the foundation for more robust, data-driven trading decisions in the ever-dynamic crypto space.
