
April 25, 2023
In this quarterly report, BTC Volatility Surface plus a deep dive analysis into DeFi Options Protocol "Lyra" we go over the crypto volatility space as it is still in its early stages, and there is no established framework for analyzing crypto volatility. Additionally, new venues are being built on-chain to complement traditional volatility trading, such as options built directly on-chain known as "DeFi Options". The report introduces AMM-based DeFi Options protocol Lyra!
This Q1 report is collectively written by Greg Magadini, Director of Derivatives, Amberdata; Fabio Bassani, Analyst, Amberdata; Tony Stewart, Strategic Advisor, Amberdata; Euan Sinclair, Strategic Advisor, Amberdata; and Samneet Chapel, Quantitative Researcher, LedgerPrime.
FORWARD
Analyzing the crypto volatility space is still a nascent game and the regimes that crypto volatility displays haven’t been figured out yet.
Another wrinkle in the crypto volatility space are the innovative venues being built on-chain to complement a more traditional volatility trading experience, which can be found on-screen at Deribit or blocked traded through Paradigm.
In April 2020 two new projects began to pioneer the idea of options built directly on-chain. Opyn and Hegic each brought a unique vision for trading on-chain options, aka “DeFi Options”.
Similar to early versions of on-chain spot trading, brought by “Ether Delta” and “Uniswap”, DeFi Options first came to market in two distinct visions:
- The AMM (automated market-marker) pool model, was pioneered by Molly Wintermute over at Hegic.
- The CLO (central limit order book) model was built by the Opyn team.
Since April 2020 there have been many other DeFi option protocols built, including a new strategy known as DOVs (DeFi Option Vaults) first pioneered by Ribbon Finance.
Although CeFi venues such as Deribit have shown a lot of success building the traditional CLM model, replicating something similar on-chain comes with a unique set of challenges.
It’s still up for debate what the best method for DeFi Options is going to be, but after the massive success seen from Uniswap, a smart AMM for DeFi Options has shown a lot of promise.
In this report, we will introduce the LYRA protocol, which is an AMM-based DeFI Options protocol.
INTRODUCTION
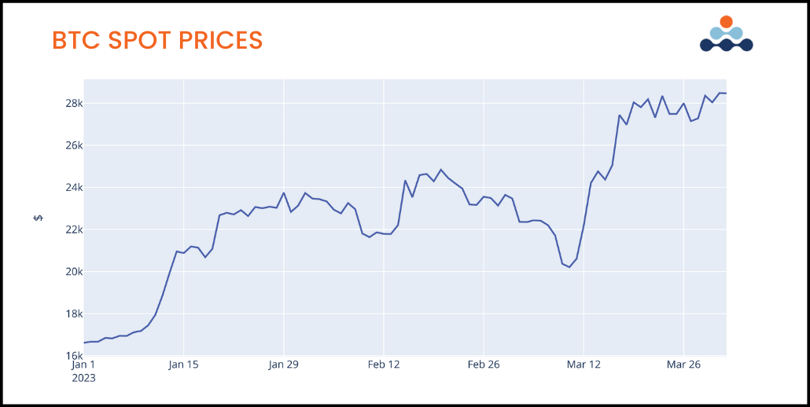
After the way that BTC spot prices and the associated volatility surface traded in 2022, it was nearly a foregone conclusion that BTC traded as a risk asset with the potential for violent crashes, similar to the behavior seen in equities.
Reflecting on the spot/vol activity witnessed in Q1 2023 we can quickly say that 2022 activity isn’t a precedent set in stone. So far, Q1 2023 has completely flipped 2022 on its head.
BTC has traded with a positive spot/vol correlation and now resembles the volatility profile of an “alternative money” such as gold.
The SVB bank run, which has caused the Federal Reserve to respond with liquidity accommodations, is now a catalyst for both BTC and Gold prices to rocket higher.
We will examine the behavior of the BTC vol surface in Q1 2023.
We will then explore the Lyra protocol as an alternative venue and inspect the trading flow on Lyra versus Deribit.
Finally, we conclude with research, conducted by Samneet Chepal at LedgerPrime, exploring 0DTE options traded on Deribit.
ATM Term Structure
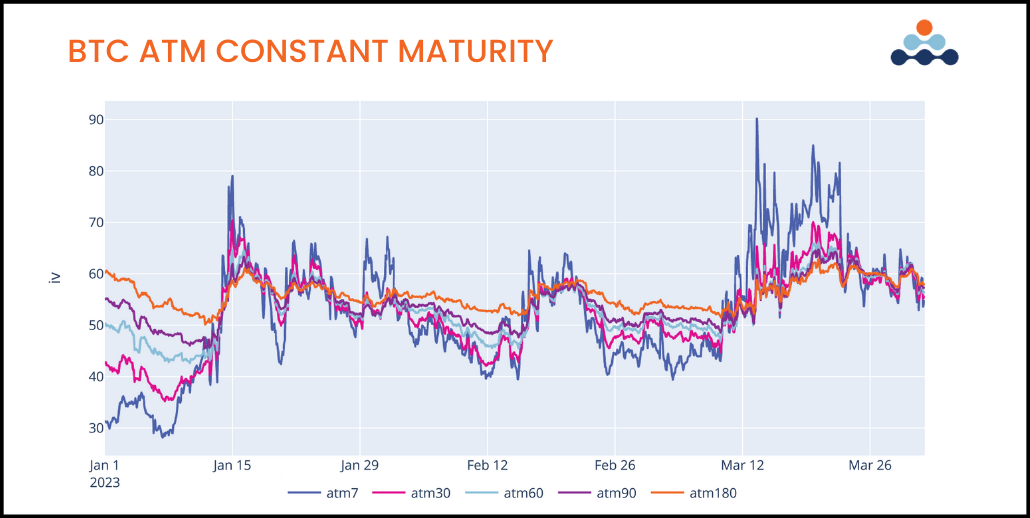
This year BTC saw two very significant volatility moves, both triggered by upside price action.
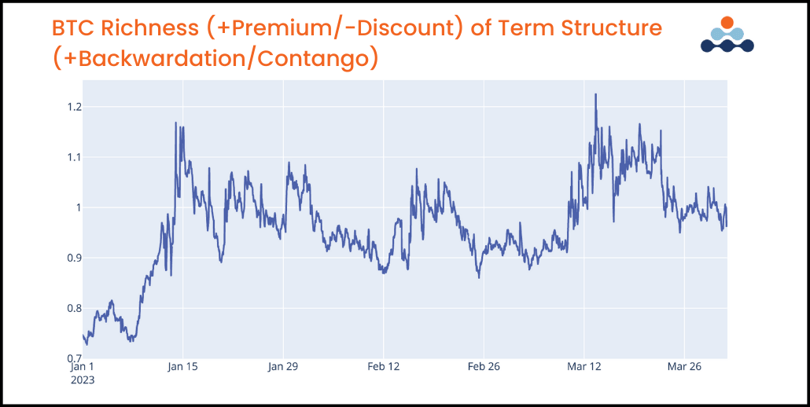
This is something quite different from 2022 because of both the spot/vol cycle and the term structure richness.
Going into the EOY 2022 both RV and IV were dismal- ly low. After the fireworks brought on by the FTX col- lapse, BTC began forming a bottom as selling velocity dripped out of the market and prices consolidated.
We can see that 7-day ATM volatility opened January 1, 2023 around 30% IV.
This type of aggressively low BTC IV sent the term structure into a steep Contango, printing about 0.74 net discounts in the term structure at the beginning of 2023.
As BTC prices broke out of a bottoming formation, velocity came into the market. This price action, in January 2023, coincided with a rally in gold and a drop in treasury yields.
The narrative around a pause in credit-tightening provided fodder for a BTC rally.
When the employment report for January beat expectations by a wide margin, we saw gold quickly drop and yields rally, BTC however began to decouple and show relative strength.
The true divergence from “risk-asset” to “alternative money” came to fruition during the SVB bank crisis.
We initially saw BTC drop along with equities. This sent the ATM IV term structure into backwardation, similar to 2022 flows initially.
Over that weekend, the Fed announced a liquidity plan for SVB depositors and others in the broader banking sector. This caused BTC to quickly make new YTD highs and trade into the $28.5k range.
Another strong example of a BTC “FOMO” rally causing the term structure to flip into a rich backwardation of nearly 1.20.
SPOT VOL DYNAMICS
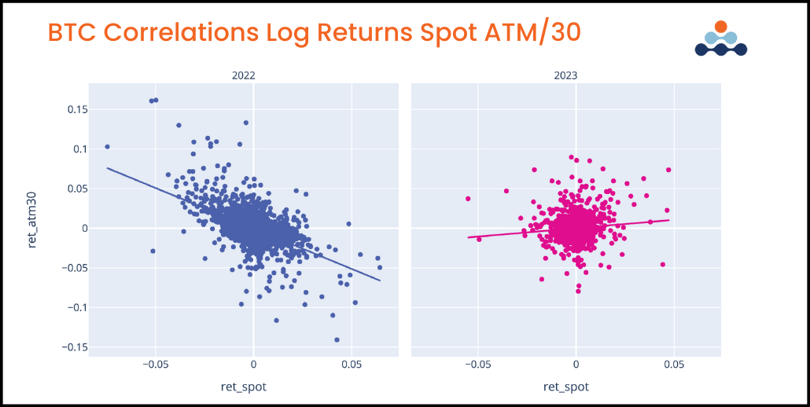
2022 stands out as a regime-changing year. We can see a much more negative scatter plot slope and a “tighter” range of readings.
On the rolling plot, we can also notice deeply negative and persistent readings of the beta values.
One of the big questions in crypto vol is whether this shift is cyclical (temporary) or structural (persistent).
In traditional markets, equity spot/vol regimes will be negative (like we see in 2022 for BTC) but commodities often display a positive relationship, as production & demand shocks affect the commodity volatility space in a different way.
Spot/vol relationships in Q1 2023 reversed the 2022 dynamic.
We can see from the scatter plot the overall trend be- tween changes in ATM30 IV and spot price changes.
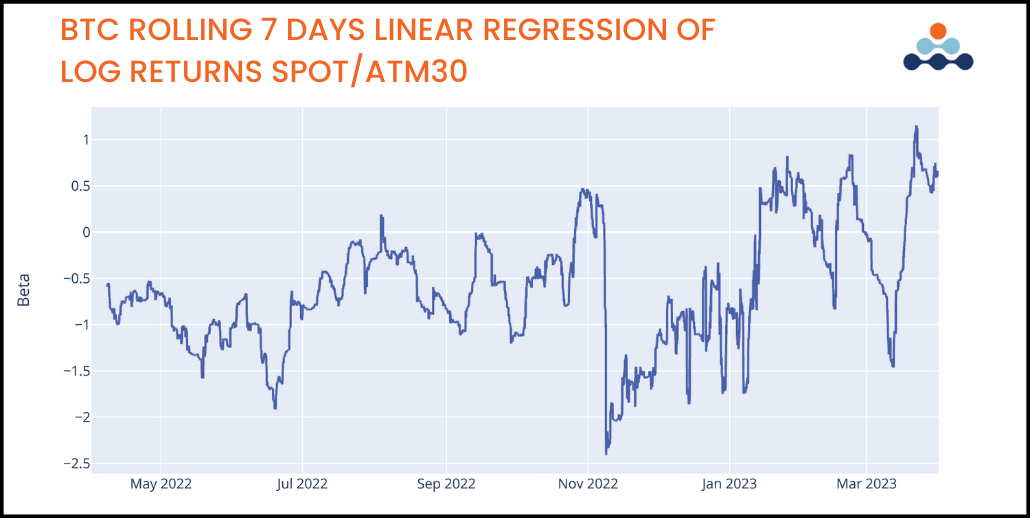
Looking at the 7-day rolling regression of these two parameters shows a more precise picture of when this positive correlation was most and least pronounced.
As already mentioned, the breakout of a bottoming formation in mid-January triggered the start of a positive spot/vol regime in Q1. Brief counterexamples were seen at two key moments:
- In early February with the release of the strong employment report for January
-
The initial reaction from the SVB banking crisis
Overall, BTC was able to recover from those two key negative spot/vol catalysts to maintain an overall positive picture in Q1 2023.
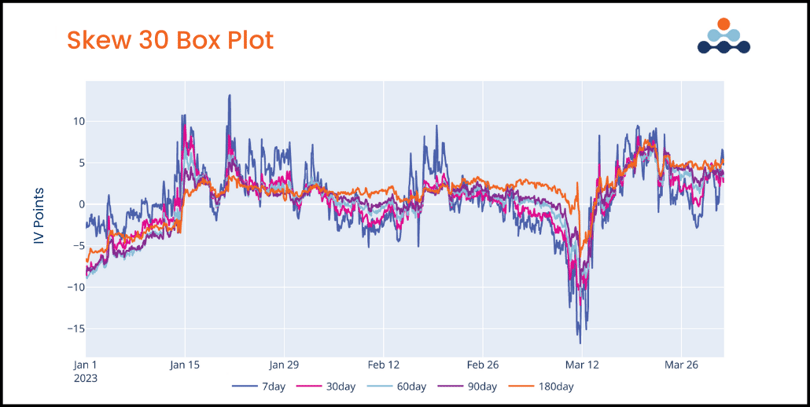
Looking at the 25-delta risk reversal we notice two distinctly different reactions from the examples just mentioned.
First, in reaction to the strong jobs report in early February, we can see the long-dated risk reversal remains anchored while shorter-dated maturities dropped lower into negative values.
Second, the SVB banking crises caused all risk-re- versal maturities to move lower, at least initially, in tandem then quickly recover.
This is peculiar given that long-term maturities are normally more anchored as they reflect median relationships of longer sample periods.
Another interesting insight is how quickly long-dated risk reversals flipped into positive territory despite the volatility surface of 2022 being so decidedly negative for spot/vol dynamics.
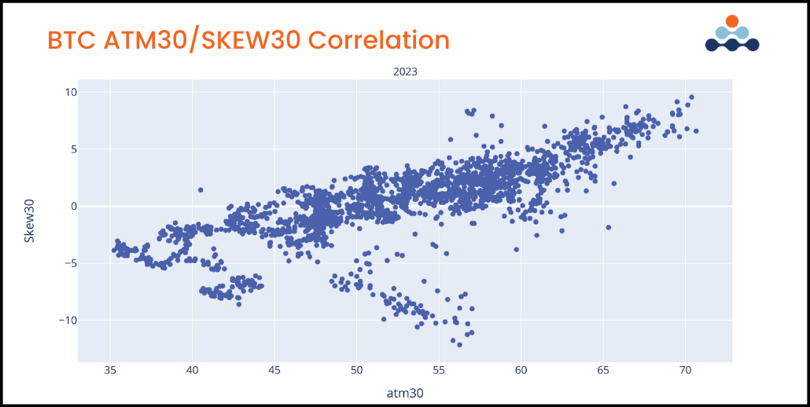
Looking at the scatter plot of the ATM30 IV and the risk-reversal levels, we can see how tightly the two moved in tandem. The spot/vol dynamics in the implied space are tight.
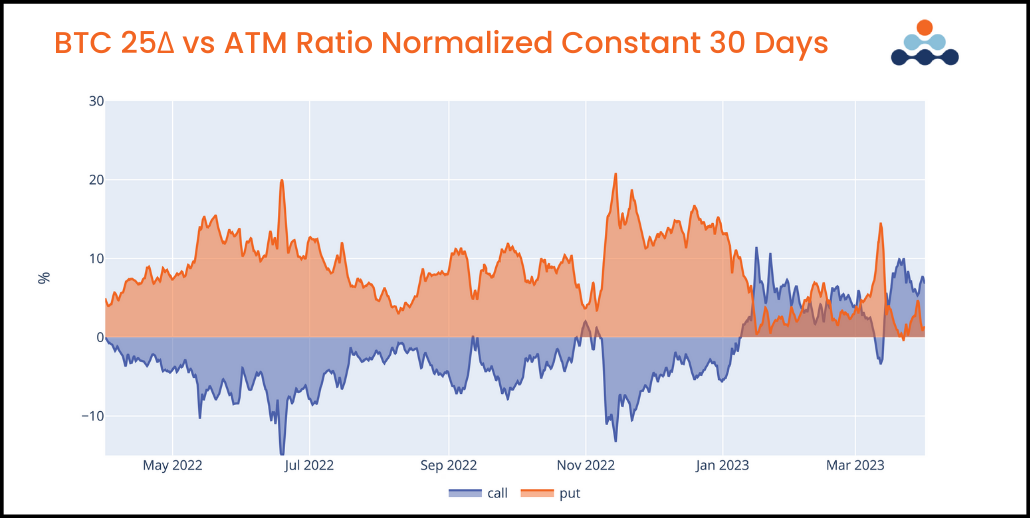
The way this translates directly into the 25-delta segment of the surface is by repricing the call wing higher than the ATM vol.
Throughout 2022 the 25-delta call wing traded at a discount to the ATM implied vol, in Q1 2023 the wing premium came back.
This type of repricing could suggest a structural change in options trading flow and call selling supply (for example, if BTC miners stopped selling calls against future mining rewards, etc).
VOLUMES
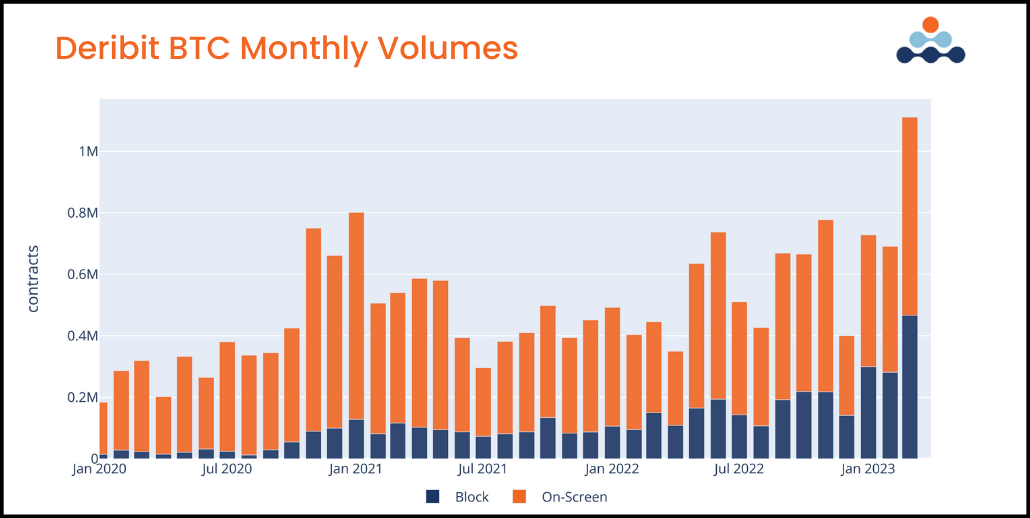
There’s an interesting story to be told in the option volumes seen this year.
First, BTC monthly contract volumes hit an all-time high in March 2023 on Deribit, both in terms of total trades and block trades.
This is significant as it shows participation in the recent spot price rally. There are real opinions being expressed in this market. This isn’t a low liquidity move pushing the vol surface around, this is real flow.
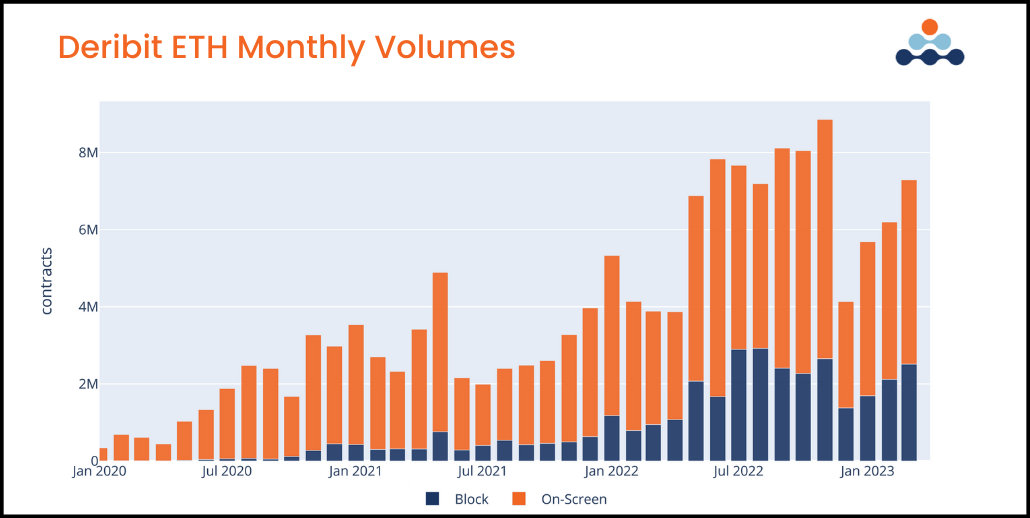
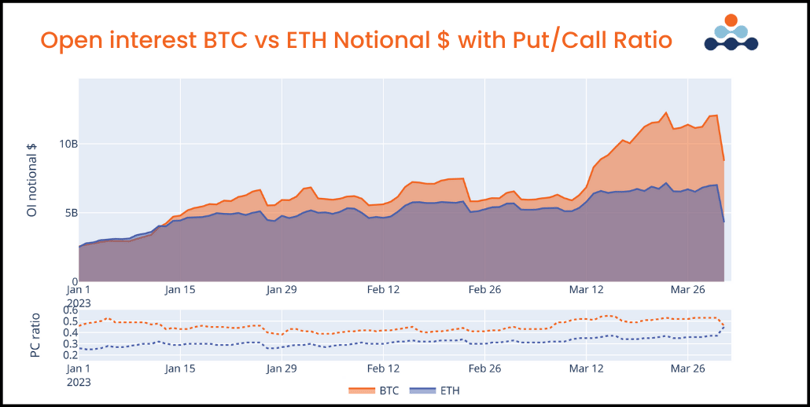
Secondly, another important phenomenon is the relative volume and open interest between BTC and ETH.
2022 was the year of the great awakening for
ETH option traders, while 2023 is a return to BTC dominance, both in terms of total volume traded and open interest outstanding.
The significance of this is potentially two-fold:
- BTC's value proposition is more of an "alternative money" pure-play compared to ETH.
- BTC lives in the jurisdiction of the friendlier CTFC as a “commodity” compared to ETH’s ambiguous categorization between “commodity” and “security”, especially post-PoS merge.
Lastly, another interesting point is the convergence of the P/C ratio for both BTC and ETH.
While ETH’s open interest increased for puts, BTC’s open interest grew on the call side.
FUTURE BASIS
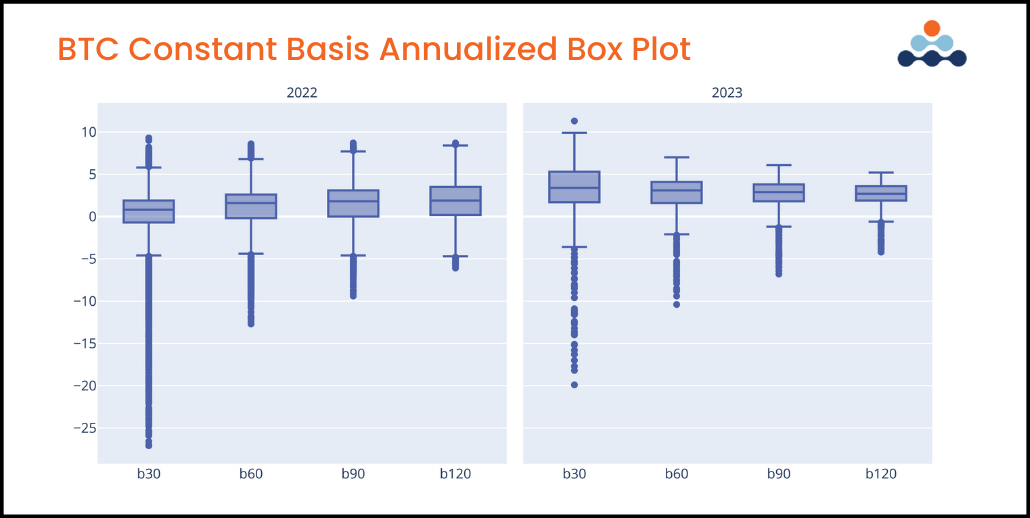
After a quiet year for the basis in 2022, we finally saw an expansion of the basis for futures on Deribit.
The 30-day basis median in 2023 was above the upper 75% percentile for all measurements throughout 2022.
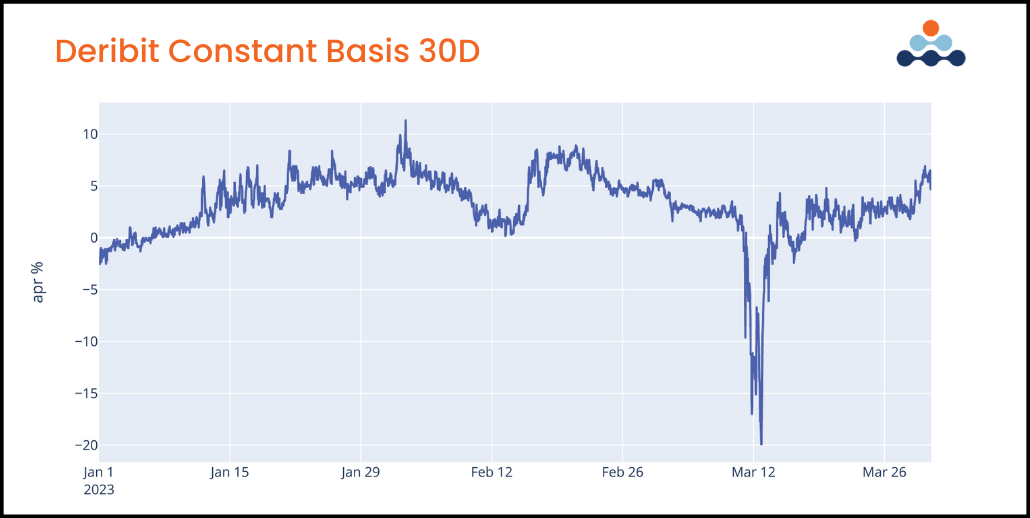
Despite seeing an overall positive basis for BTC throughout Q1, reaching a height of 10% APY, the 30-day basis still had a wide trading range.
During the SVB banking crisis, the Deribit 30-day futures basis briefly hit a level of -20% APY, only to quickly snap back into a +5% yield as BTC spot prices turned around.
This type of broad range in futures basis trading bleeds into option pricing, as the extra volatility of the basis creates an additional payout dimension for BTC options.
To continue reading the full report, click here.
