Share this blog:
.png)
As 2026 begins, the US Treasury market is emerging as the dominant macro driver for risk assets, with a steepening yield curve signaling rising debasement risks and shifting central bank behavior. This week’s newsletter explores why global bond dynamics, precious metals outperformance, and historically cheap Bitcoin volatility could converge into a compelling right-tail setup for BTC. With key labor data ahead, the macro backdrop may be more consequential for crypto than price alone suggests.
USA Week Ahead (ET):
- Wednesday 8:30 am - ADP Employment
- Friday 8:30 am - US Employment Report
MACRO Overview
Happy New Year, everyone!
I’m very excited for 2026 and everything it’s going to bring.
I’m going to start discussing the big-picture macro trends that I think will continue (and possibly accelerate in 2026) and could significantly impact BTC prices this year.
Although I rarely discuss the UST curve in this newsletter, I spent four years of my prop trading career at Chopper Trading in Chicago, exclusively trading the yield curve.
The biggest theme in 2026 is the US Treasury bond market.
- Trump will appoint a new Fed chairman in 2026.
A. Trump has been very straightforward about needing lower rates. - The Labor market.
A. Do we continue to soften? - Inflation.
A. Can cheaper oil keep prices down?
B. Do increasing demands for electricity from AI build offset any relief from cheaper oil? - USD
A. Are precious metals predicting something the market has yet to price in elsewhere?
I can’t help but think the US Treasury curve continues to Steepen in 2026 (and beyond).
This seems like one of the clearest conviction trades that comes to mind.
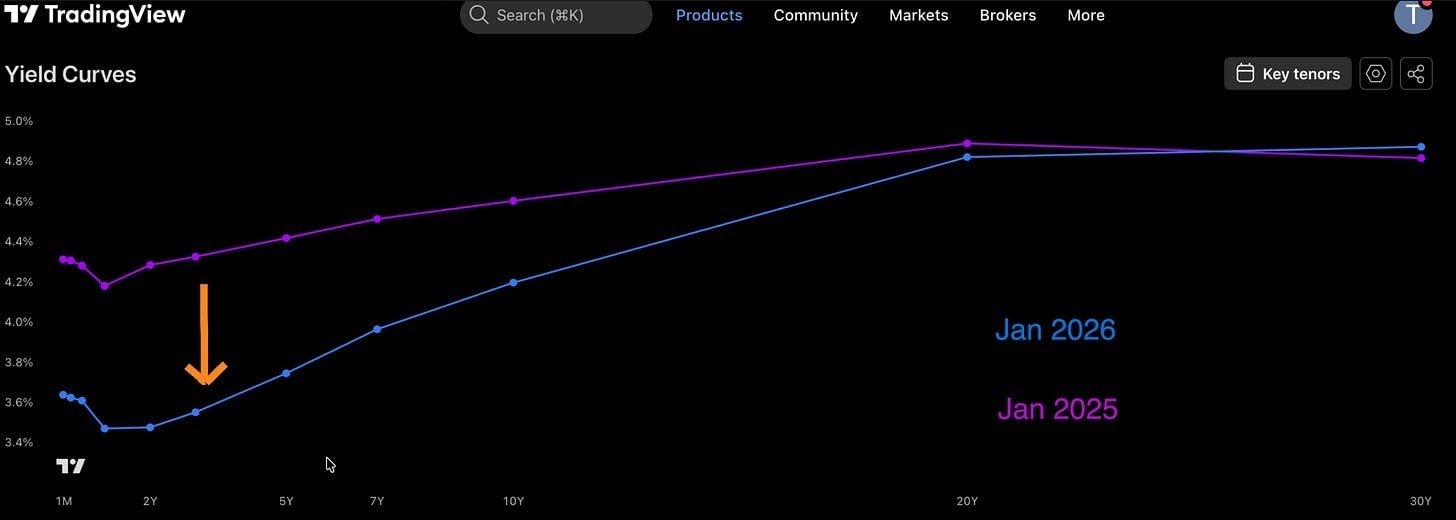
We can see that from Jan 2025 to Jan 2026, the front-end of the UST curve has come down a lot as the Fed has cut rates.
The Fed can mostly control the front-end of the UST curve, while the long bond reflects investor sentiment and anticipation of inflation.
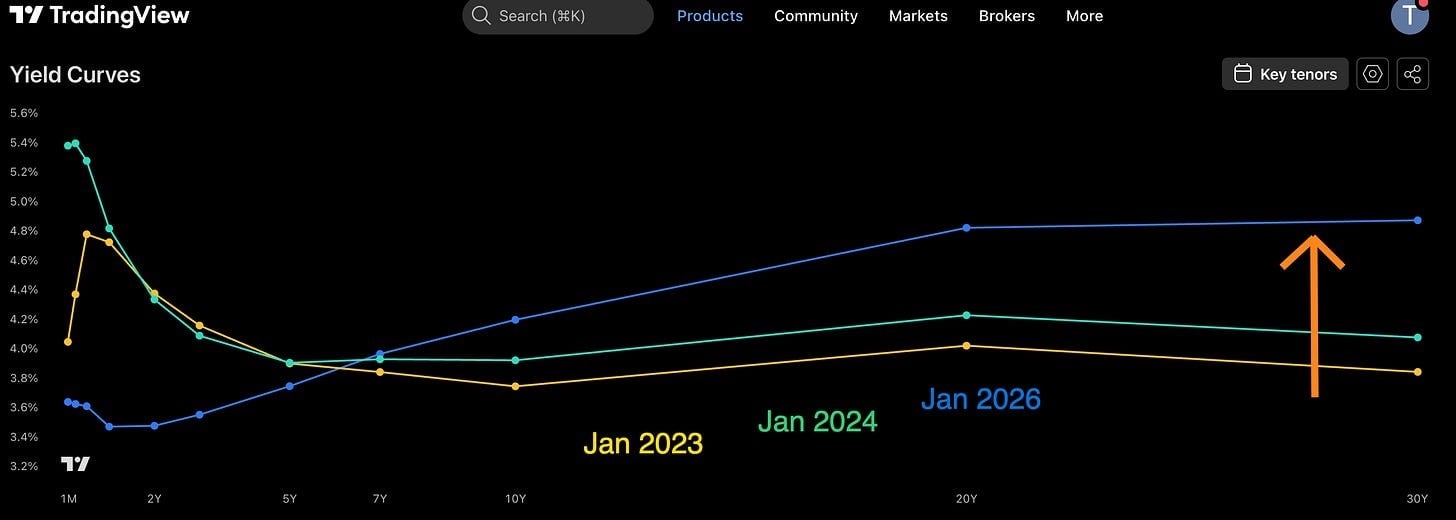
We can see that this steepening trend has been in place since Jan 2023. As the Fed moved away from a hawkish cycle to a dovish one. The inverted yield curve of 2023 normalized into a Contango structure that’s likely going to be exacerbated in 2026 and beyond.
If we look at some neighboring yield curves, we can see this is even more true.
Today
US (Debt/GDP = 125%)
5s30s = +1.10% [baseline]
2s10s = +0.72% [baeseline]
Japan (Debt/GDP = 236%)
5s30s = +1.86% [+76bps to US]
2s10s = +0.90% [+18bps to US]
UK (Debt/GDP = 93%)
5s30s = +1.28% [+18bps to US]
2s10s = +0.80% [+8bps to US]
Italy (Debt/GDP = 135%)
5s30s = +1.59% [+49bps to US]
2s10s = +1.29% [+57bps to US]
Italy (Debt/GDP = 114%)
5s30s = +1.63% [+53bps to US]
2s10s = +1.33% [+61bps to US]
Internationally, when looking at other highly indebted countries in the Western world, we see SOME steeper yield curves as the central banks become buyers of last resort for the bond markets.
My thoughts and biases are as follows:
- Fiat debasement has occurred throughout history and will likely occur again, especially as countries need to finance wars.
- As debasement occurs, yields want to rise to compensate for a loss in purchasing power of “future dollars”. Budget deficits get worse as debt servicing costs rise.
- Central banks cut rates (in the front-end) to reduce debt burden costs.
- Governments shift financing to short-term bonds, where there are lower rates, to finance deficits.
- Eventually central banks become buyers of those short-term bonds to defend “rate targets” as debt supply exceeds natural investor demand.
- Debasement becomes clear and long-dated paper finds no buyers while short-term paper gets pegged down to low rates. (Steepening).
Open questions:
Can fiat debasement occur without a bond crisis?
How do assets react on “initial shock” when long-bond yields rise uncontrollably? (Panic? Risk-off)?
- Japan is the most advanced in the debt/gdp levels
- They don’t have a full-scale military and rely on US protection
- Geopolitical risks between China/Taiwan are increasing,
Eventually they pay to build a military (I would think) and then what happens if they cannot buy US Treasuries anymore due to fiat debasement… Are bond crises contagious?
(Does the Japan bond crisis get exported to the US?)
What are these precious metal charts telling us?
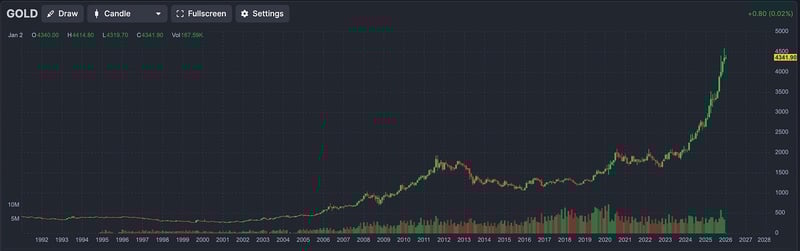
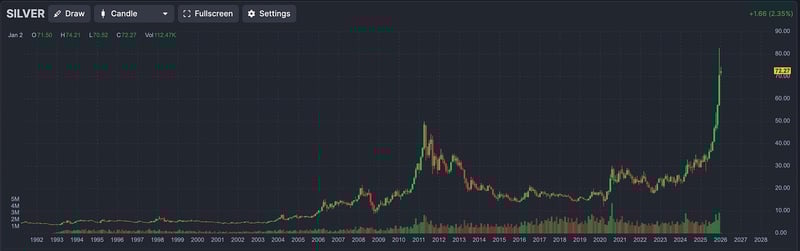
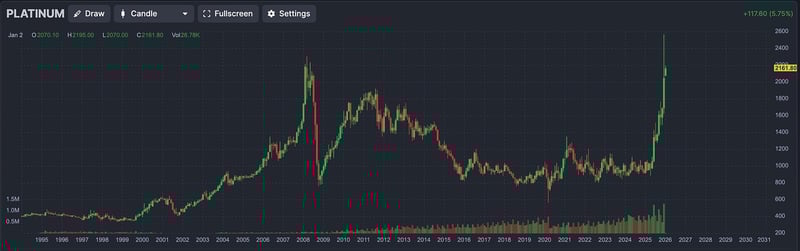
US 30y bonds are yielding 4.9% but silver rallied +150% in 2025 alone.
The Federal Reserve is likely going to be too “dovish” in 2026 as opposed to “too hawkish”. Especially given the new Fed Chairman coming in May 2026.
Any weakness in employment is unlikely to be deflationary imo, as I think that would fuel the Fed to react even more. It’s almost counterintuitive that US Growth would be the best outcome against inflation.
Anyways, this week we have ADP employment on Wednesday and the unemployment report on Friday.

BTC: $91,312 (+3.7% / 7-day)
ETH: $3,136 (+6.7% / 7-day)
SOL: $134.89 (+8.6% / 7-day)
Crypto Options Overview
Why has crypto underperformed precious metals in 2025? What happened here?
My thesis is that despite positive US regulation, a successful IBIT ETF launch, growing IBIT option flows, US corporate DATs… the big difference is this:
Central Banks and Governments buy GOLD (The Sovereign).
Private citizens and private corporations buy Bitcoin.
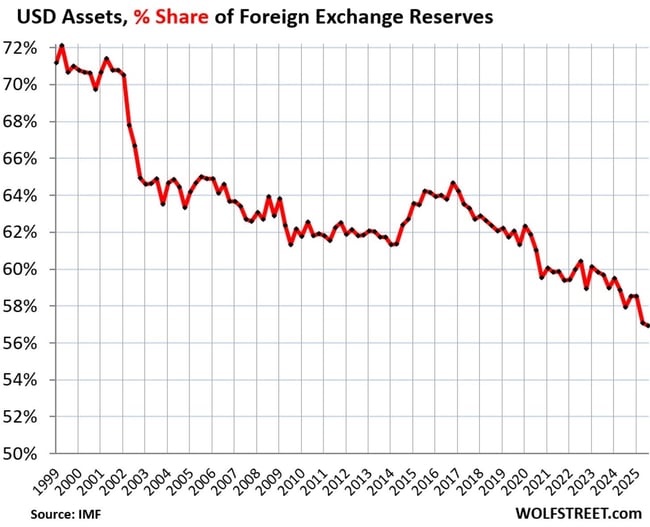
As the USD reserve system comes into question, the main divestment from USD into alternatives has been led by the “Sovereign,” not the private.
I’ve been seeing a similar chart on X.com to support this thesis.
It’s easy to want to get long a million IBIT calls in anticipation of “SILVER” chart performance in 2026, but I’m not totally sold on the idea yet. At least not for irresponsible size.
Will sovereigns wake up to Bitcoin as a USD alternative?
Is the retail buyer already fully invested?
Do corporate DATs like MSTR, BMNR, ETHZ, etc, go from net buyers of coins into net sellers if their stock values continue to drop?
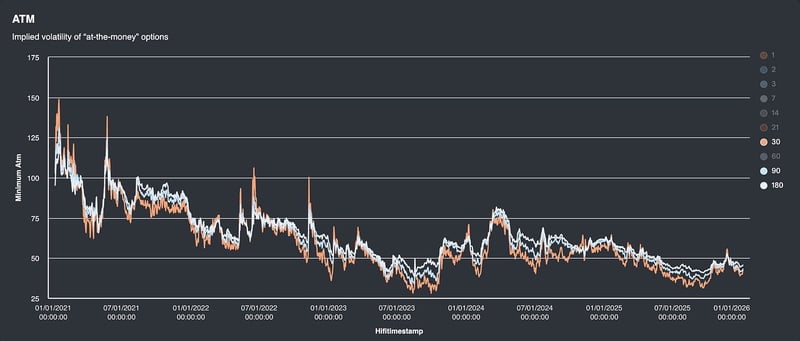
One thing is for sure, since the launch of the IBIT options and the subsequent adoption, we can see Bitcoin volatility has steadily been sold down in 2025.
There’s a good argument for some long Vega, delta neutral strategies (or slight delta long bias) here… Given where precious metal volatility sits and the current volatility levels in Bitcoin being historically low. (Divergence).
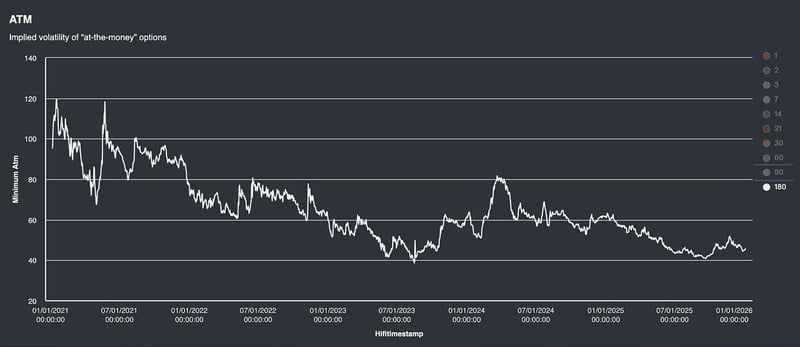
Isolating Deribit 180-day volatility, we can see 45% IV is near the all-time low of 40%. Worth considering. Silver 180-day IV is currently 50%.
intelligence.amberdata.com
The flows from traditional investors (as opposed to crypto natives) have supplied the market with call paper, as IBIT holders have been selling covered calls for yield.
We can see the Deribit upside RR-Skew is now near historical lows (only during the Terra Luna and FTX bankruptcies was it lower).
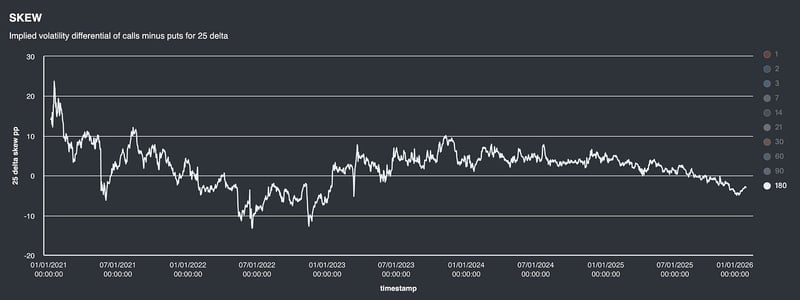
intelligence.amberdata.com
This provides a good opportunity to own Vega from upside calls. A Silver/Gold/Platinum ramp higher could quickly reprice this entire narrative.
intelligence.amberdata.com
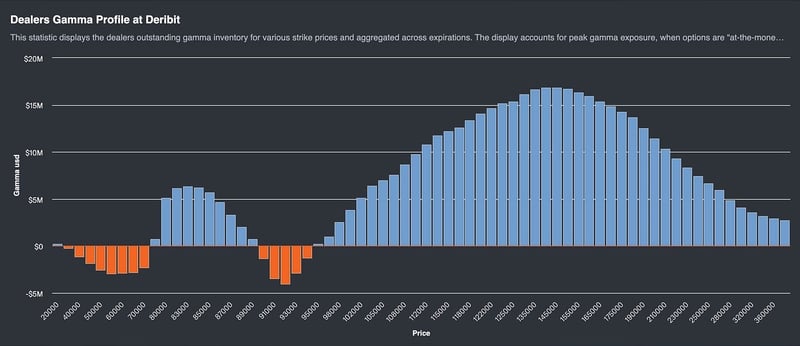
The dealer gamma profile supports the thesis of upside calls being sold, likely through covered calls.
TradFi investors might have been too quick to “sell-their-upside” in order to add income to their portfolios.
TradFi aims for +10% annual portfolio returns, selling BTC upside for income fits into that strategy… but crypto natives have seen crazy upside FOMO cycles before.
Precious metals have contextualized our current environment and grabbing at BTC upside exposure through long-term OTM calls seems decent here (but only as a small lottery ticket position… not the farm).
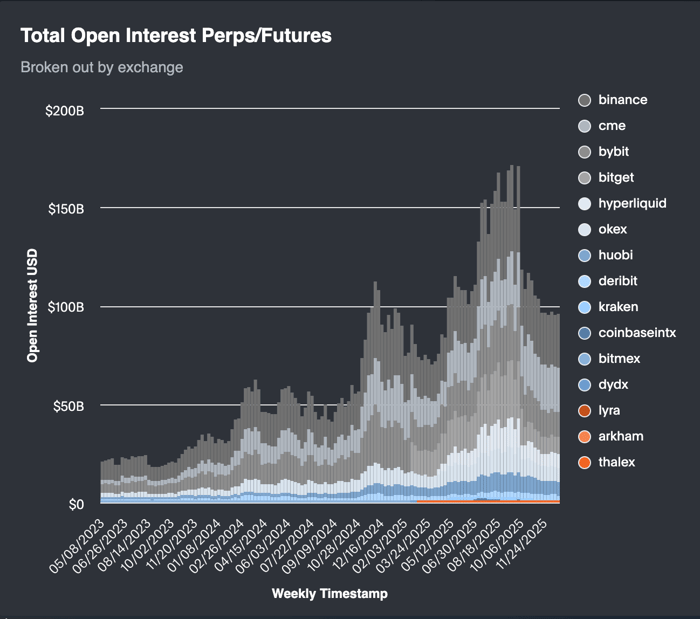
intelligence.amberdata.com
Since the October 10th, 2025, liquidations cycle, we can see futures/perps positioning has come down.
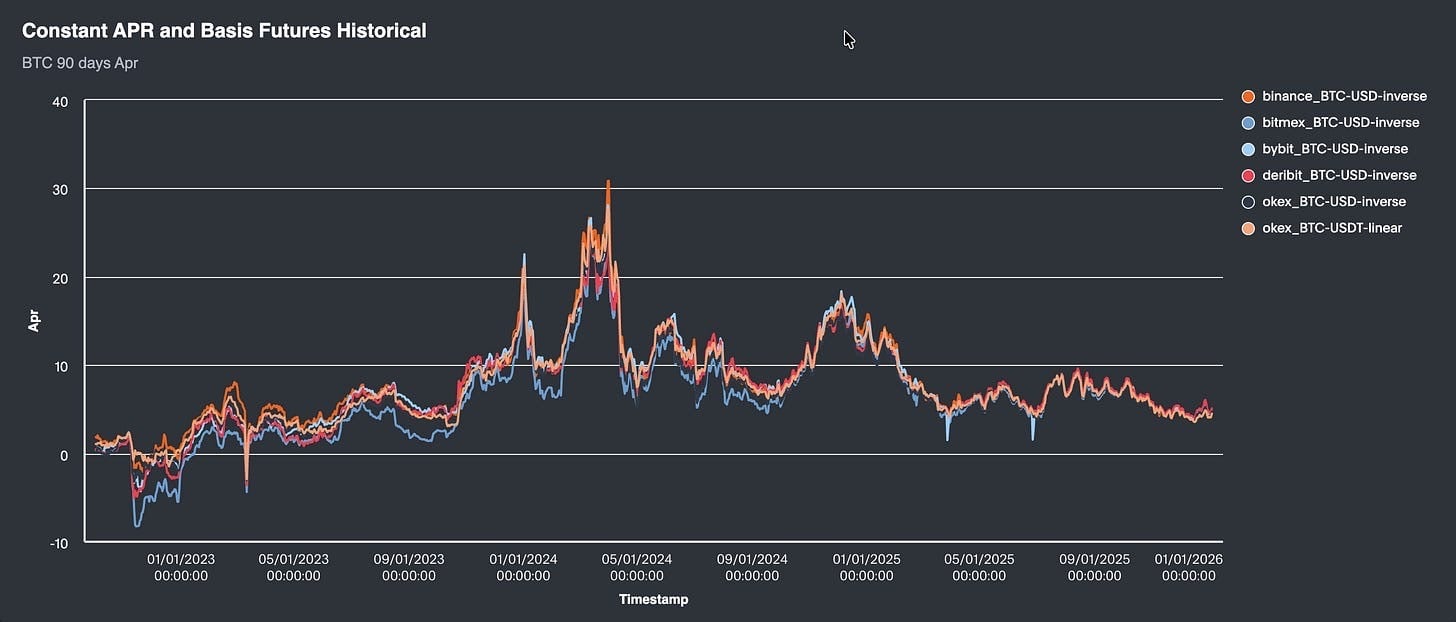
intelligence.amberdata.com
The Bitcoin fixed term basis costs is also around average levels here; we aren’t anywhere near “exuberance” like Jan 2024 or December 2024.
Should the Fed become too dovish and smash short-term rates lower… steepening yield curves and triggering more debasement flows, why couldn’t Bitcoin react like precious metals? Why couldn’t a sovereign bet on BTC?
We don’t know that these things will actually happen, but the pricing for the “right-tail” bet is attractive going into 2026 and beyond.
AMBERDATA DISCLAIMER: The information provided in this research is for educational purposes only and is not investment or financial advice. Please do your own research before making any investment decisions. None of the information in this report constitutes, or should be relied on as a suggestion, offer, or other solicitation to engage in, or refrain from engaging, in any purchase, sale, or any other investment-related activity. Cryptocurrency investments are volatile and high risk in nature. Don’t invest more than what you can afford to lose.
