Share this blog:
A Cryptocurrency Market & Blockchain exploration, using on chain data combined with exchange data to get a sense of trends. 📊
TLDR; I built a new type of visualization that represents blockchain & market data in a format to help non-technical people understand the underlying data.
A little back story:
Two years ago, I was talking with some friends about how I had been playing around with Ethereum (a Smart Contract based blockchain). Most of the discussion was around the pros/cons of blockchain, how it might affect humans in the future, etc. At the end of the discussion, it was still not clear entirely what a blockchain looked like, or even what it was being used for now. I tried to give several metaphors, however we never could really come to a mutual understanding…
Several months later, I began working with Amberdata.io, a data platform enabling many people to fast applications on blockchain and market data. We began building products to index & aggregate blockchain data, and a platform to showcase the data in different charts & views.
The goal was “simple”:
Provide data context and intelligence in a way anyone can understand.
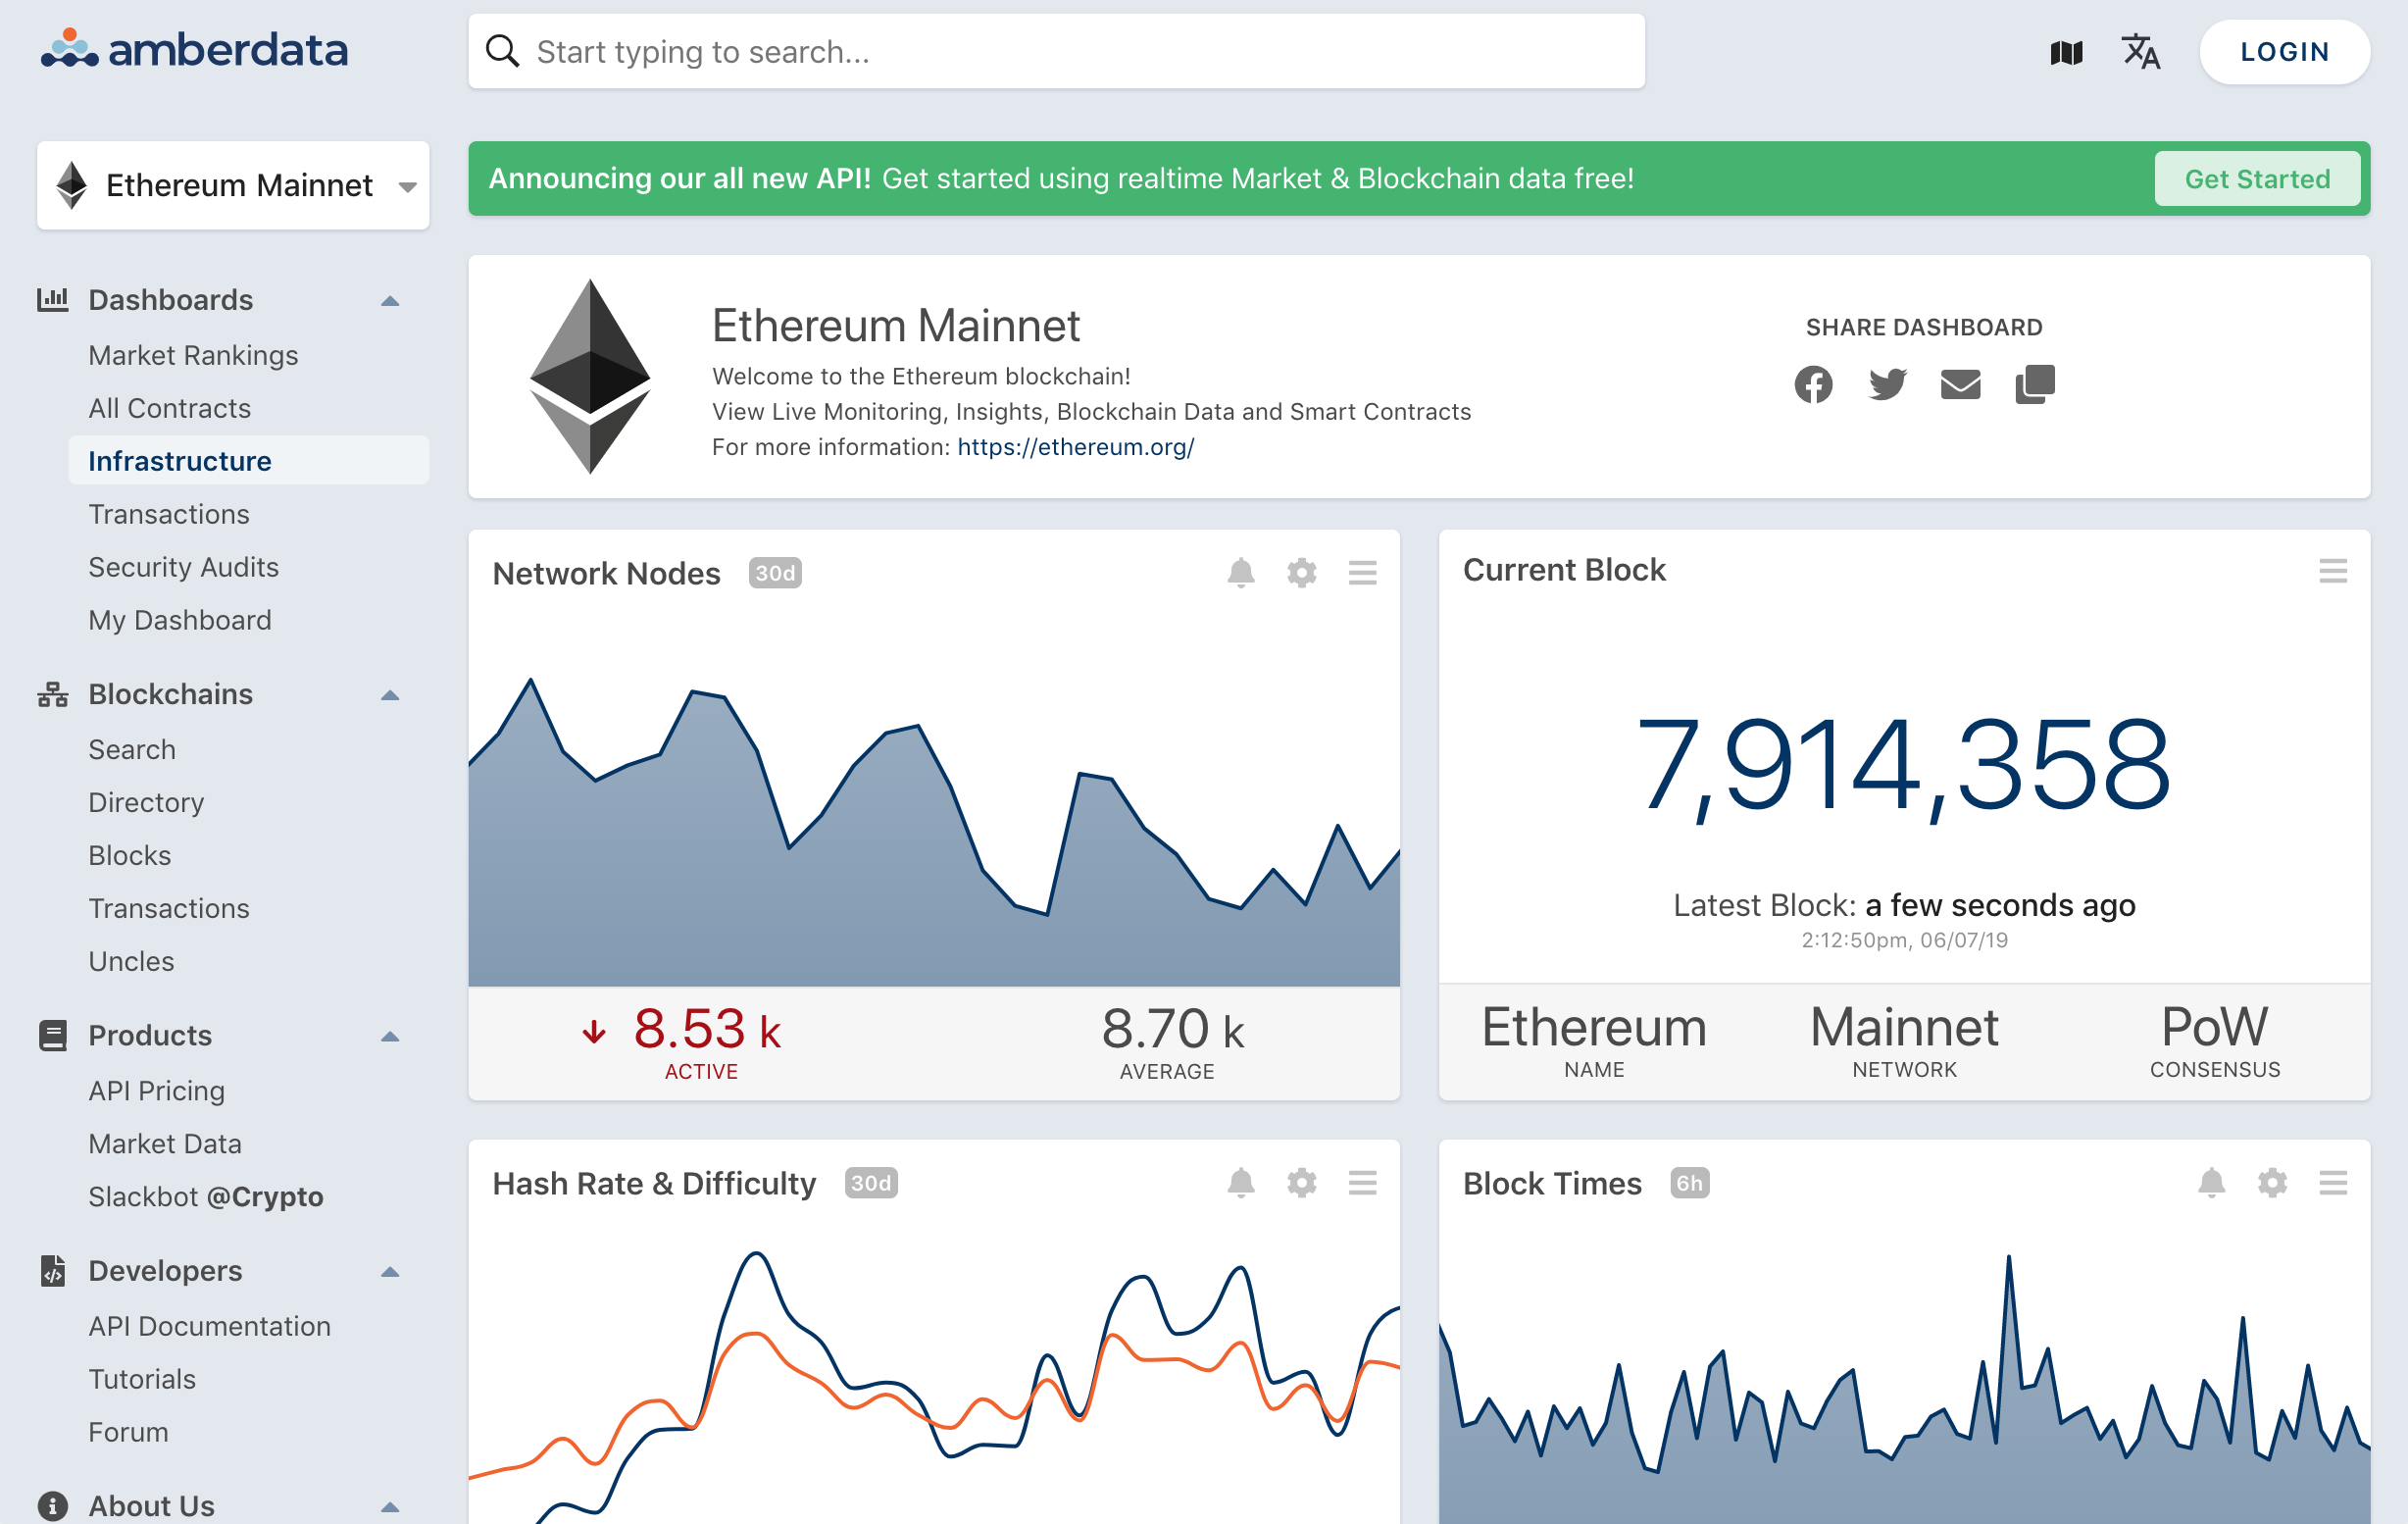
This took on many forms of the course of 2 years, a look at the current result can be seen on the left. This dashboard works well for those that know blockchain data, however it is difficult to all others without knowing key terms or context. Some of the data shown here is difficult to get, even though it looks simple enough.
Fast forward to January 2019, after discussions with fellow developers in Prague at Devcon 4, talks with side-chains like Aion, and UI/UX sessions with our team — It became clear, conveying context for many blockchains was very very difficult. In fact, it will soon be many to many blockchains, with sub-connections to things like State Channels.
Then I had a revelation — what if blockchains were more like stems of a tree, side-chains were more like branches, shards of a blockchain were like bark, and if we zoom out you could see a whole forest of blockchains. Here was the quick sketch:
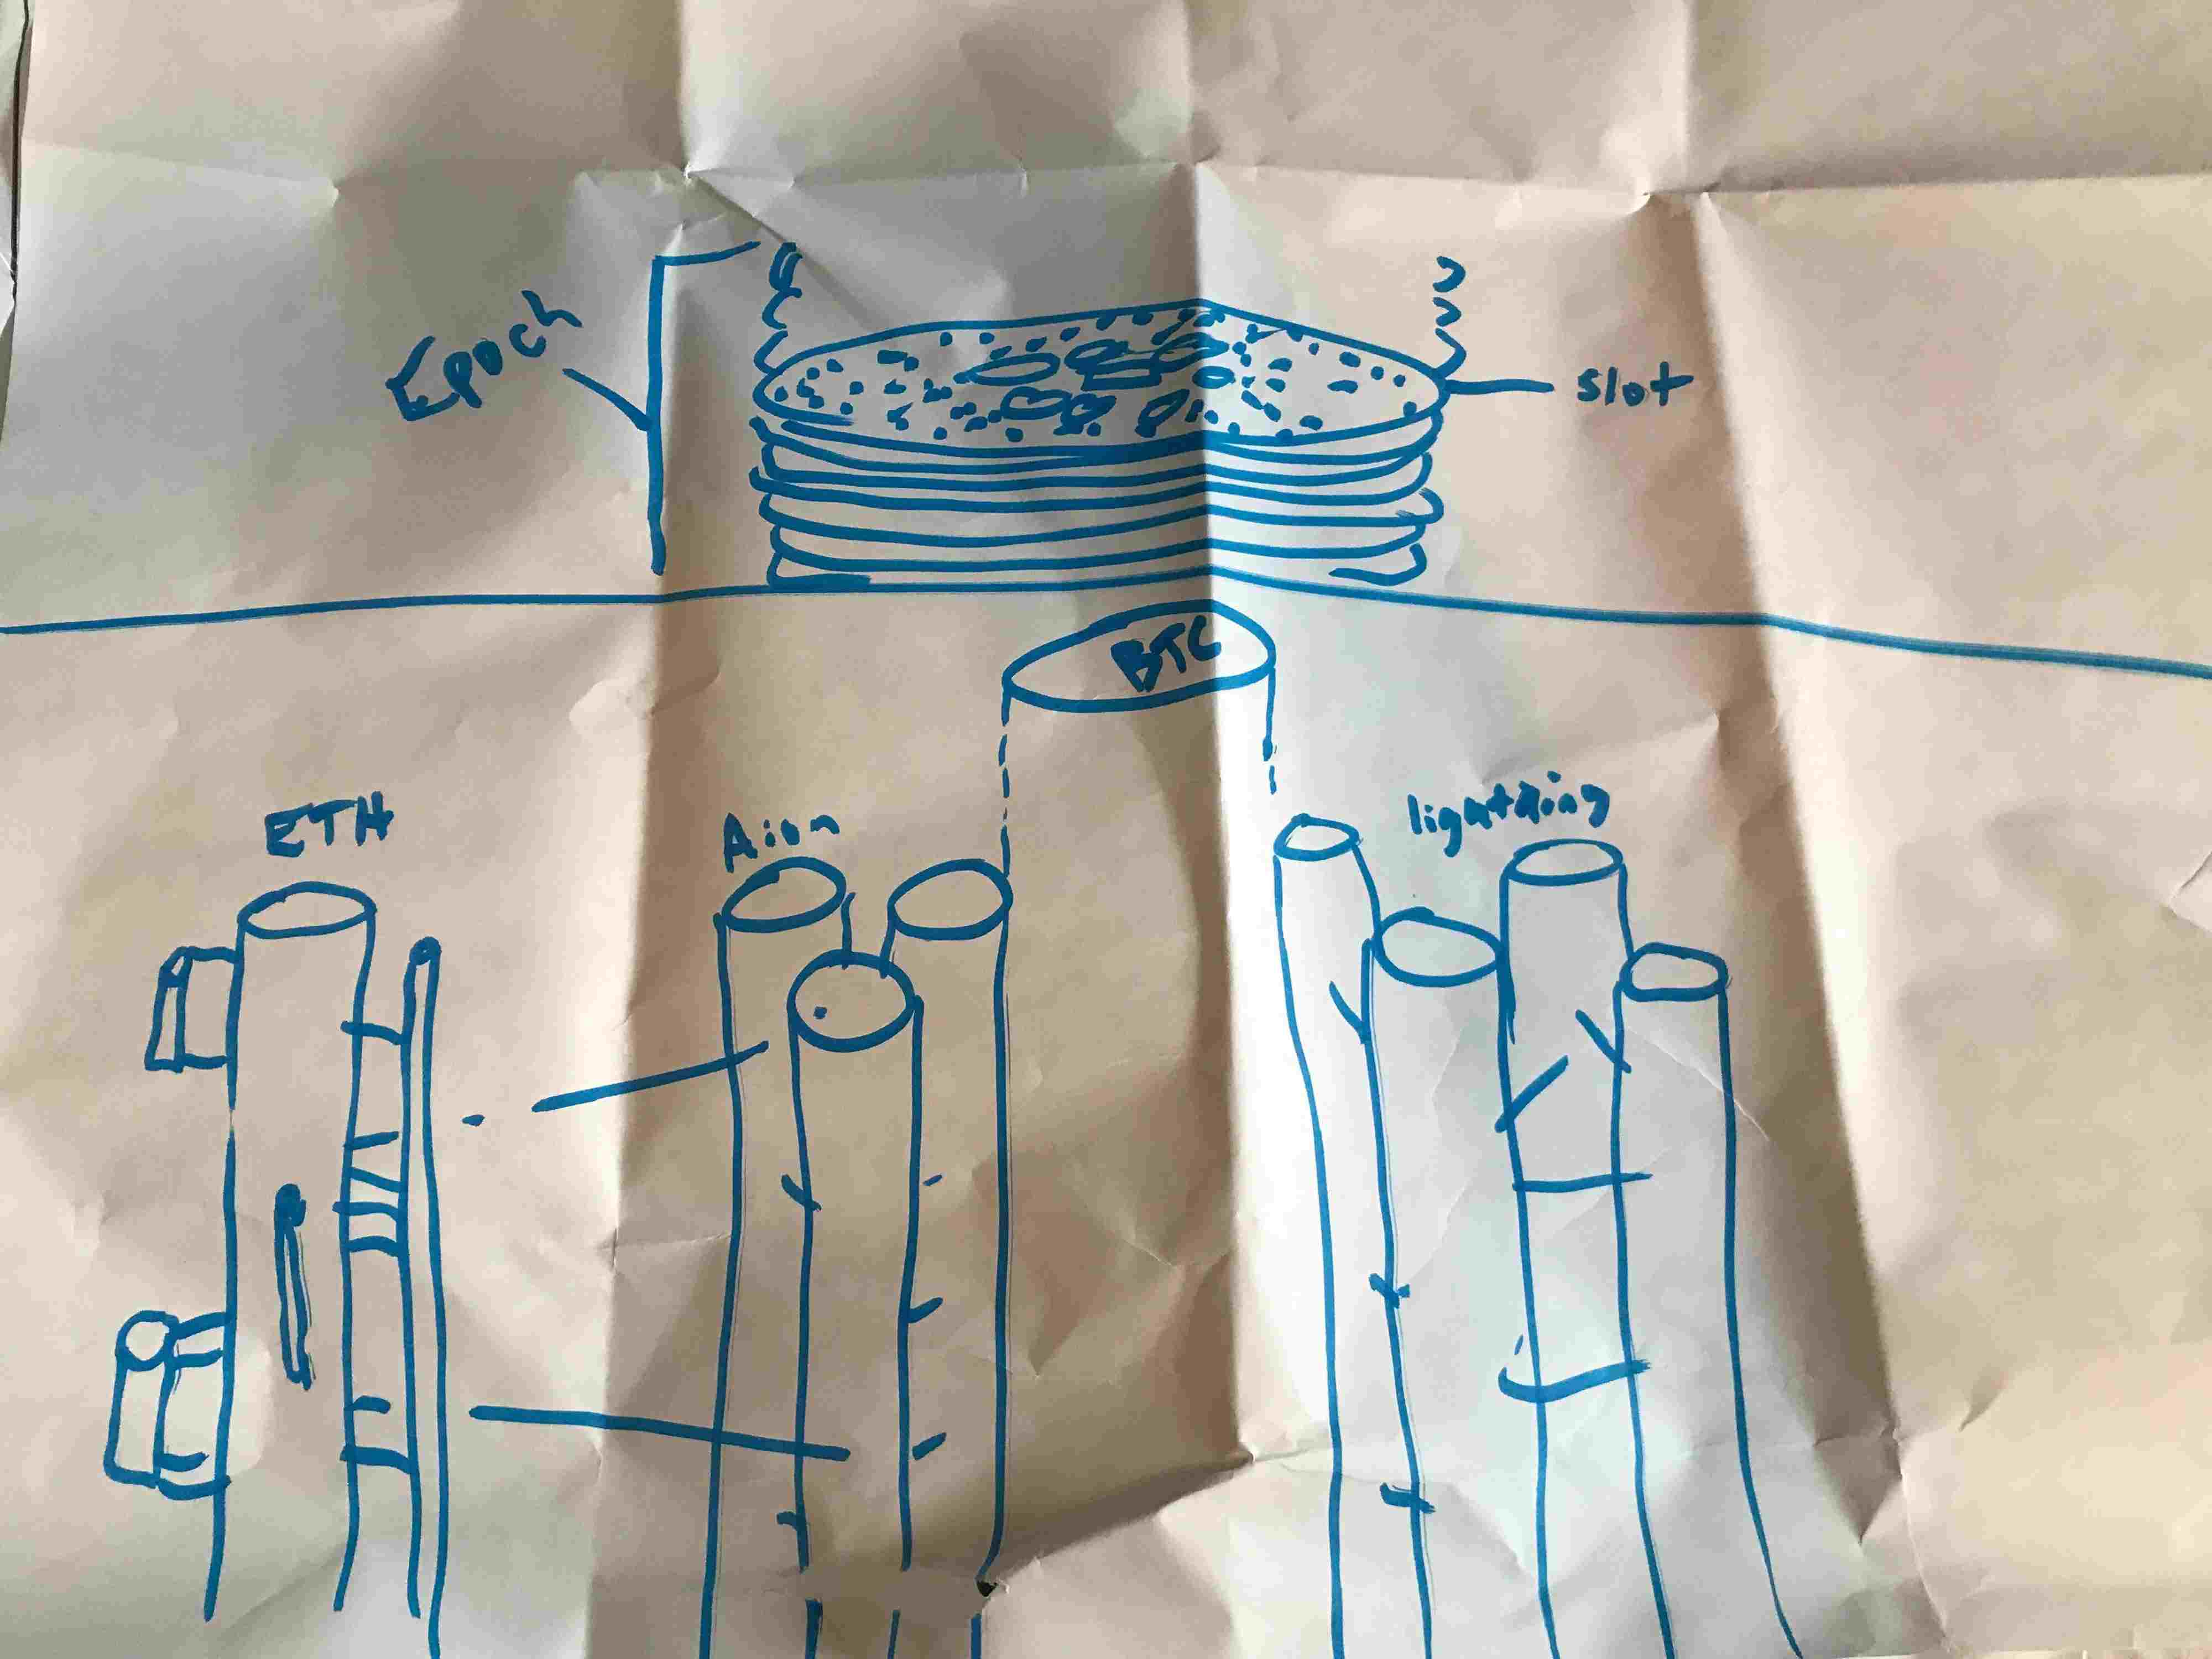
My take on representing many blockchain and their inter-connected transactions
As you can see, it starts to look like a forest of blockchains (Or as my wife put it — Cloud City). This simple sketch was getting closer… Now how to test?
This week, our team did a hackathon to test our product offering and explore different use cases of blockchain & market data. Finally, a chance to test out these ideas :)
My goal: Create a new type of blockchain visualization that anyone can understand, and get excited about!
The Process:
- Create a base level disk, representing a block, combining all the contents of a block into a sunburst style chart.
- Stack the blocks ordered by block number to represent the tree stem, and provide a timeline navigation style.
- Aggregate the visible block range into metrics that people can understand: total value transferred, tokens transferred & token valuations.
Here is the outcome:
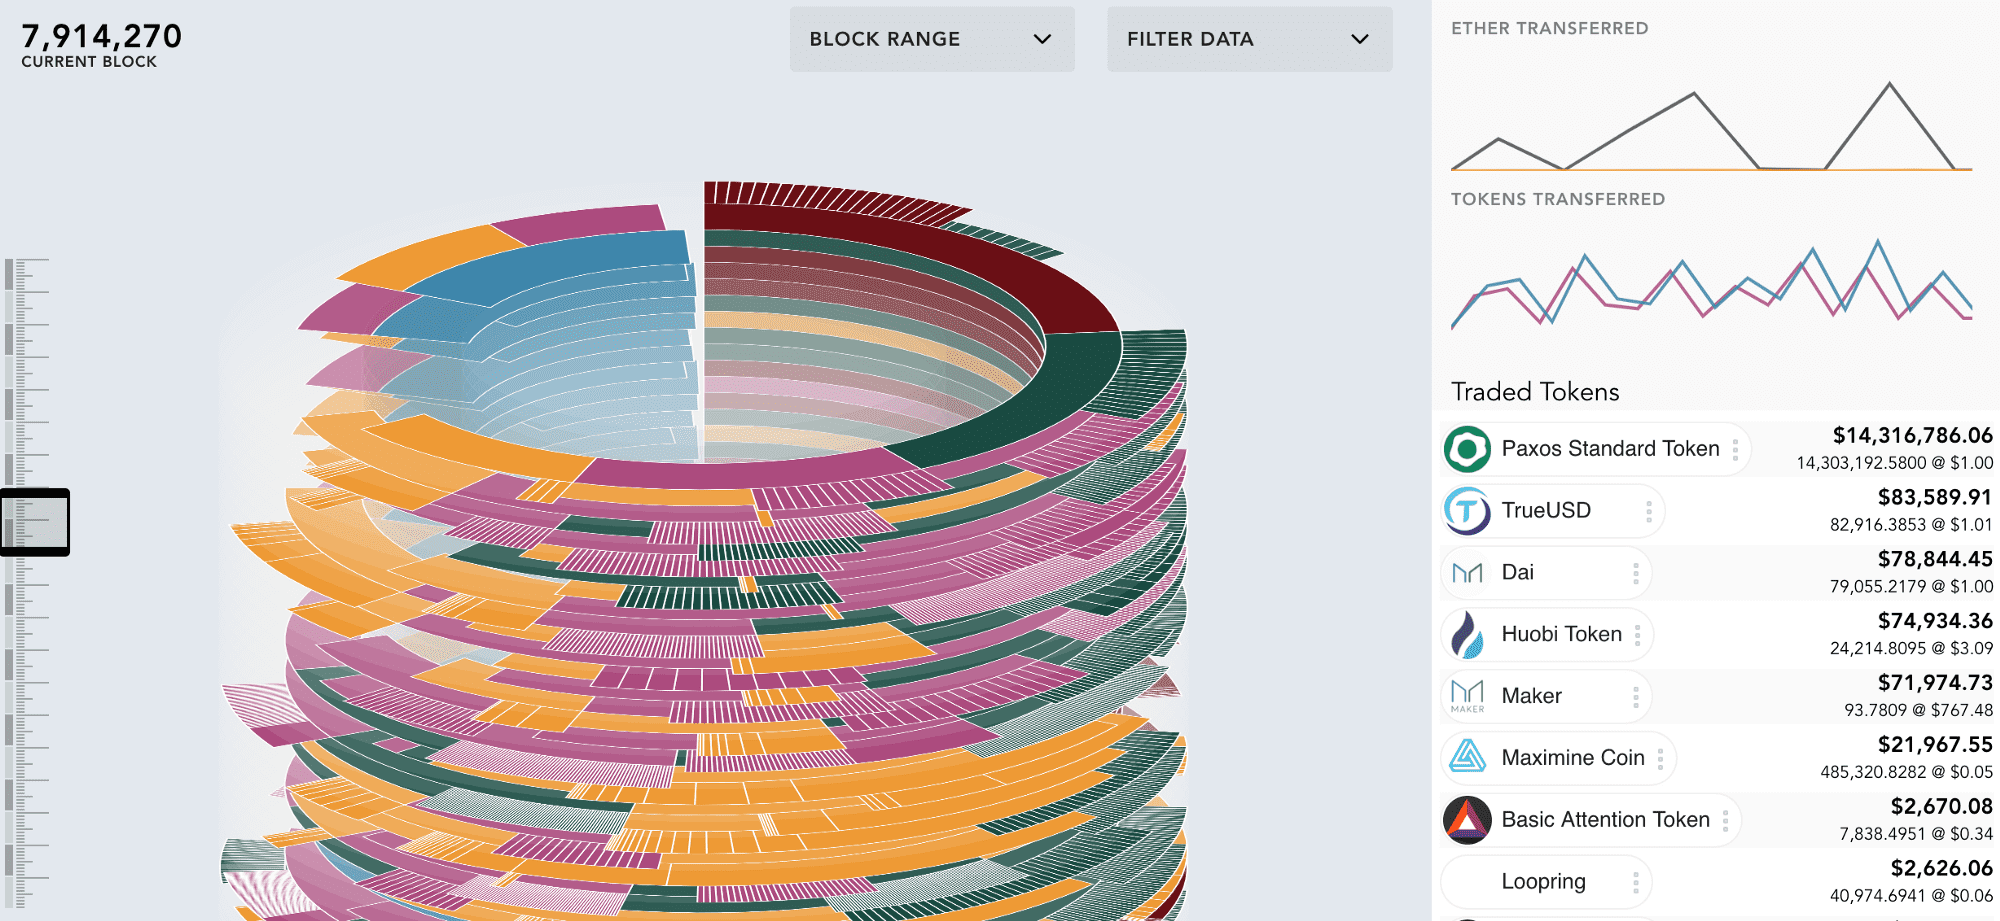
Blockchain + Market Data — Realtime context dashboard
This view allows for anyone non-technical to quickly view what a blockchain looks like, and see some of the cryptocurrencies activities as they happen.
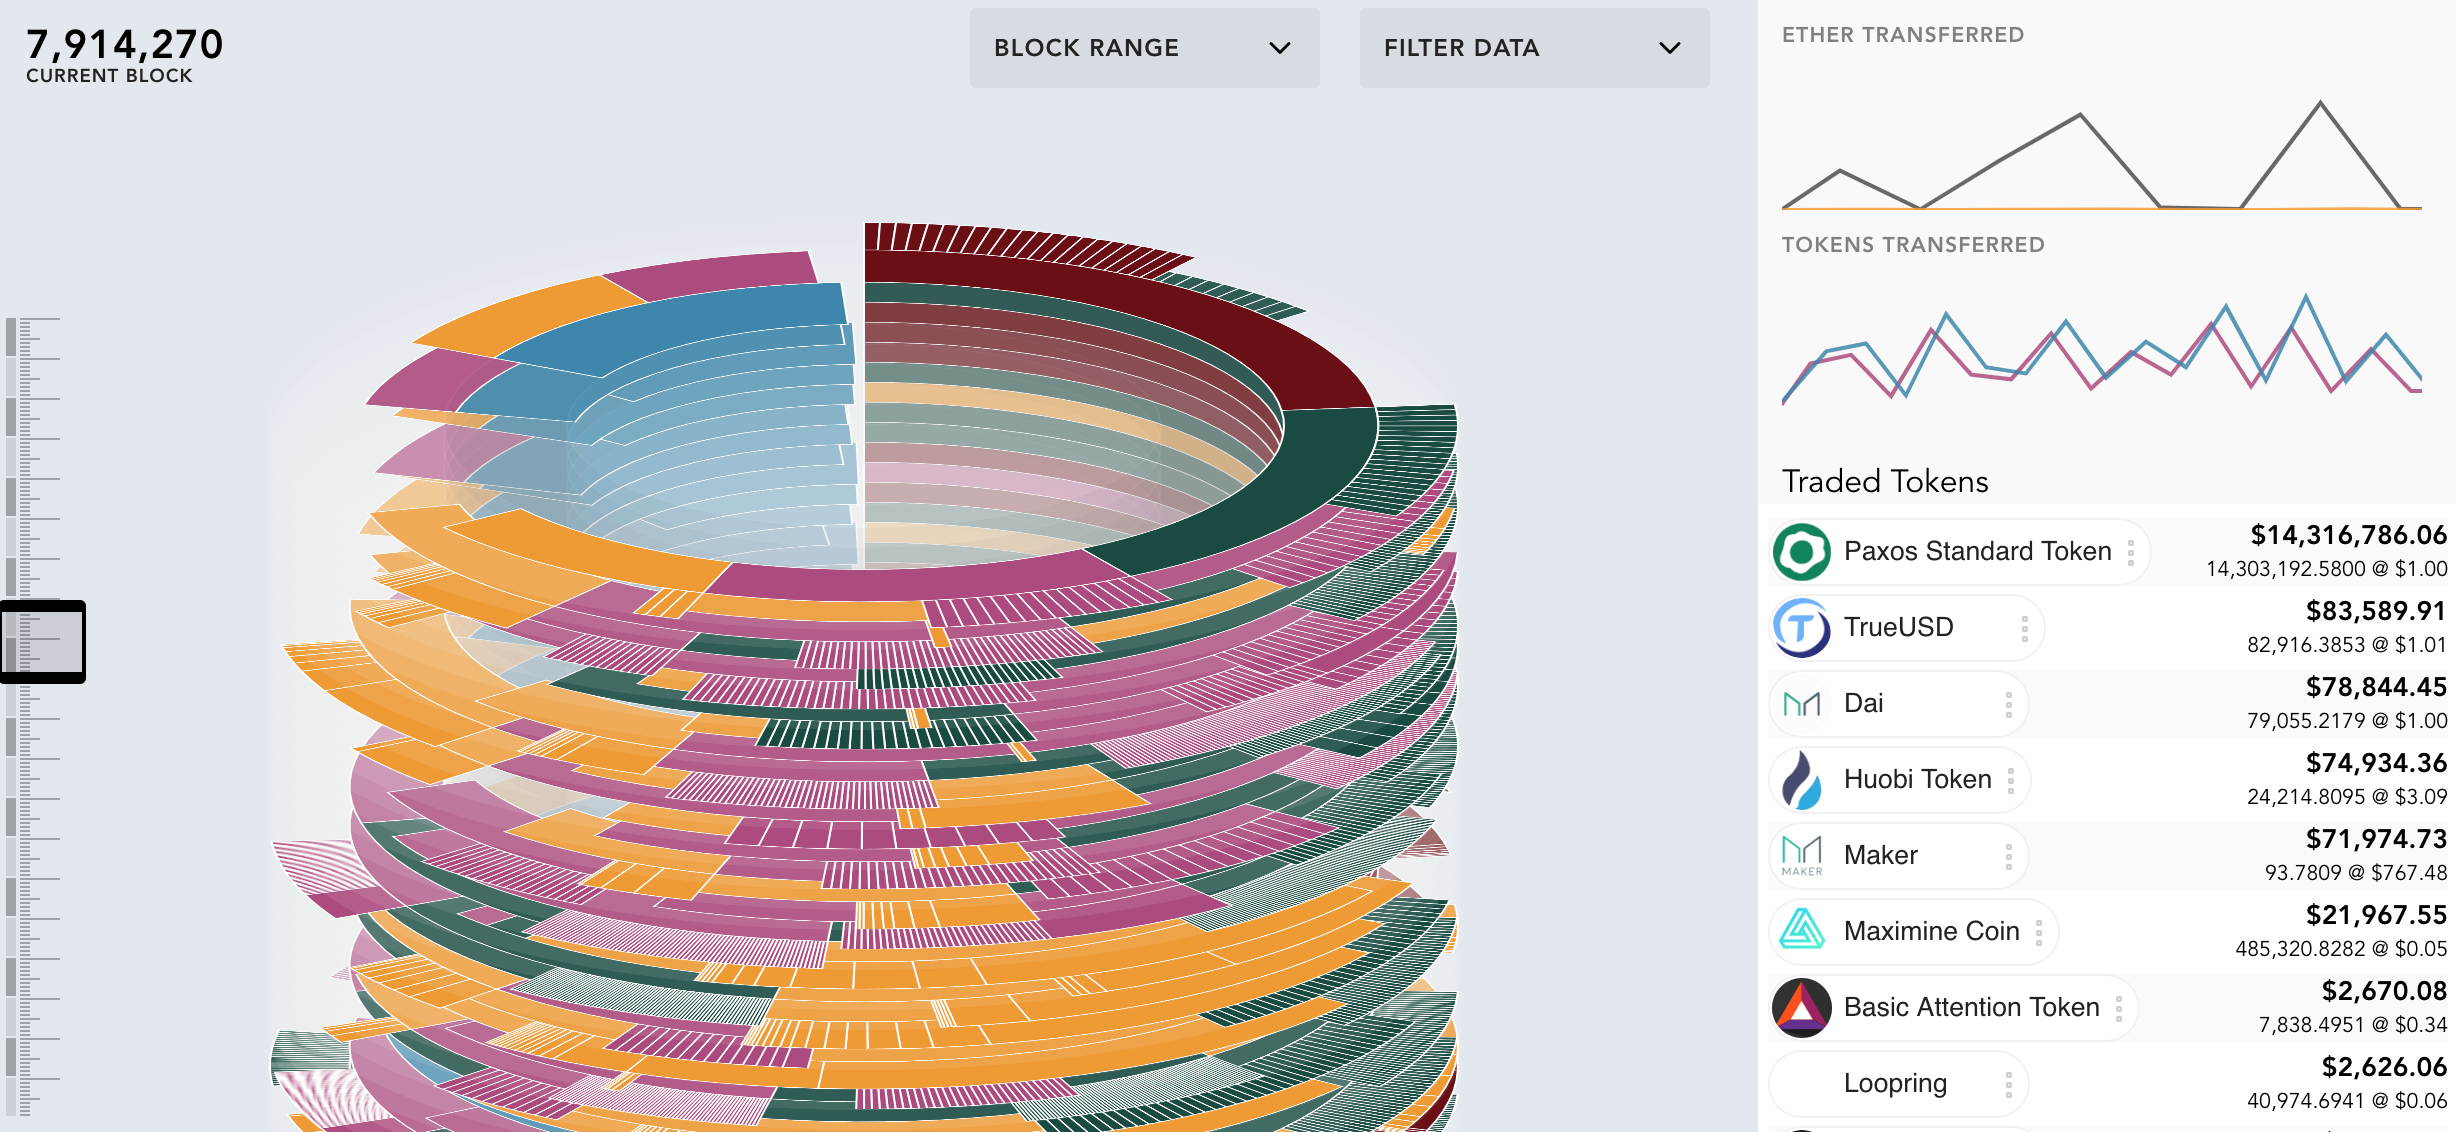
Let’s break down a single block, it has a lot of data packed in! Each block contains several types of information: Ether transferred, Data transferred, Tokens, New Smart Contract Data or Events, and finally Internal Transactions. Take a look at the following image:
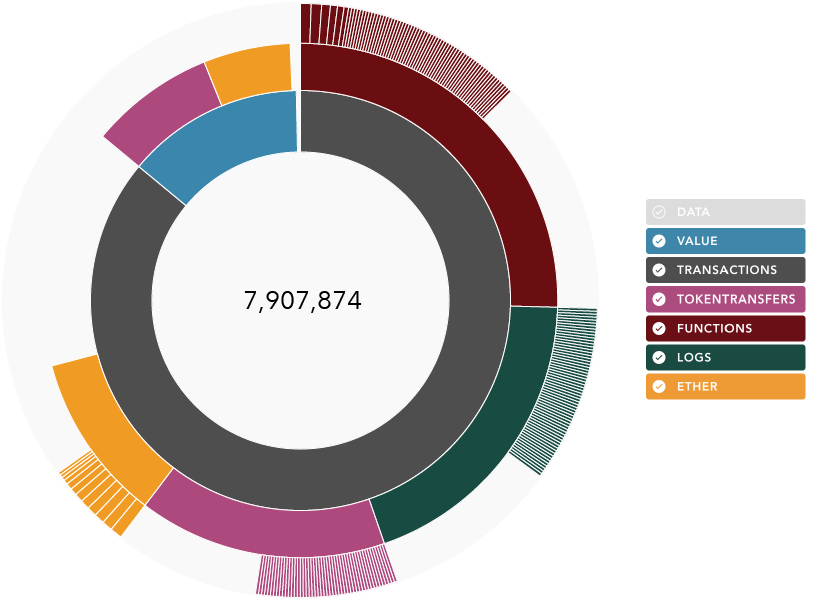
Block 7,907,874 — See more at amberdata.io
The information is now presented in a sorted fashion, color coded to represent each type of data. For non-technical people it will just look nice ;) One thing to note: I did the totals by occurrences and values, however I didn’t add the market prices to the mix in this view — I really want to add that as well so the data is weighted with even more context.
The final outcome — a realtime dashboard that combines the entire context of the visible blockchain data into a format easily understood.
If you’d like to play around with the code, click here for the source (Coming soon!).
What do you think?
Would you like to see more of this? Was it easy to understand?
This project used Amberdata.io APIs. The integration took only a few minutes and I was able to add a comprehensive amount of data to the project! Check it out here →
Fin — Stay Awesome!