Share this blog:
Understanding funding rates is essential for optimizing perpetual futures trading and managing costs effectively. Read more to explore advanced strategies, arbitrage opportunities, and key analytics that can give you a trading edge. 
Introduction
Unlike traditional futures contracts, perpetual swaps never expire. Instead, they use funding rates—regular payments made between long and short position holders—to ensure the perpetual price remains close to the spot market price. For instance, when the market is more bullish, funding rates tend to be positive, meaning long positions pay shorts. Conversely, if the consensus outlook is bearish, shorts pay longs.
These periodic costs might appear modest, but over time they accumulate and significantly affect the net profit or loss of a position. Understanding the funding rate patterns gives traders a window into whether the crowd is leaning bullish or bearish, and whether those views might be about to shift. On top of that, tracking funding rates can help you spot unique arbitrage opportunities and optimize how often you choose to open or close positions.
REDACTED offers in-depth analytics—such as Predictive Funding Rate, Realized Cumulative Funding Rate, and Rolling 24H Volume for Futures—that let you see exactly how these rates are evolving across multiple exchanges. By combining this data with other indicators like open interest and market sentiment analysis, you’ll have a more holistic understanding of crypto price dynamics.
Understanding the Influence of Funding Rates on Trading Costs
How Funding Rates Work in Perpetual Swaps
In a perpetual swap, funding rates are typically calculated multiple times per day—commonly every eight hours, though this interval can vary by exchange. If the funding rate is positive, the long positions pay a fee to the short positions. If negative, shorts pay longs. This mechanism ties the perpetual swap price to the spot price: if the swap trades at a premium, the rate generally becomes more positive, discouraging too many longs from piling in. Conversely, if the swap sits at a discount, a negative rate encourages more longs to enter, pushing the contract price back up.
Because these rates can be either a small tailwind or a steady headwind, they have a direct impact on your trading costs. If you’re paying a high funding rate over several days, your profits can erode quickly—even if the notional value of your position is moving in your favor. Conversely, if you’re on the receiving side, you might enjoy an additional revenue stream.
Predictive Funding Rate and Realized Cumulative Funding Rate
REDACTED’s Predictive Funding Rate chart helps you see where funding rates are projected to land in upcoming intervals. This feature provides a heads-up if your position is about to get expensive—or more profitable—relative to the spot reference. Armed with these insights, you can decide whether to hold or adjust positions before the new funding cycle locks in.

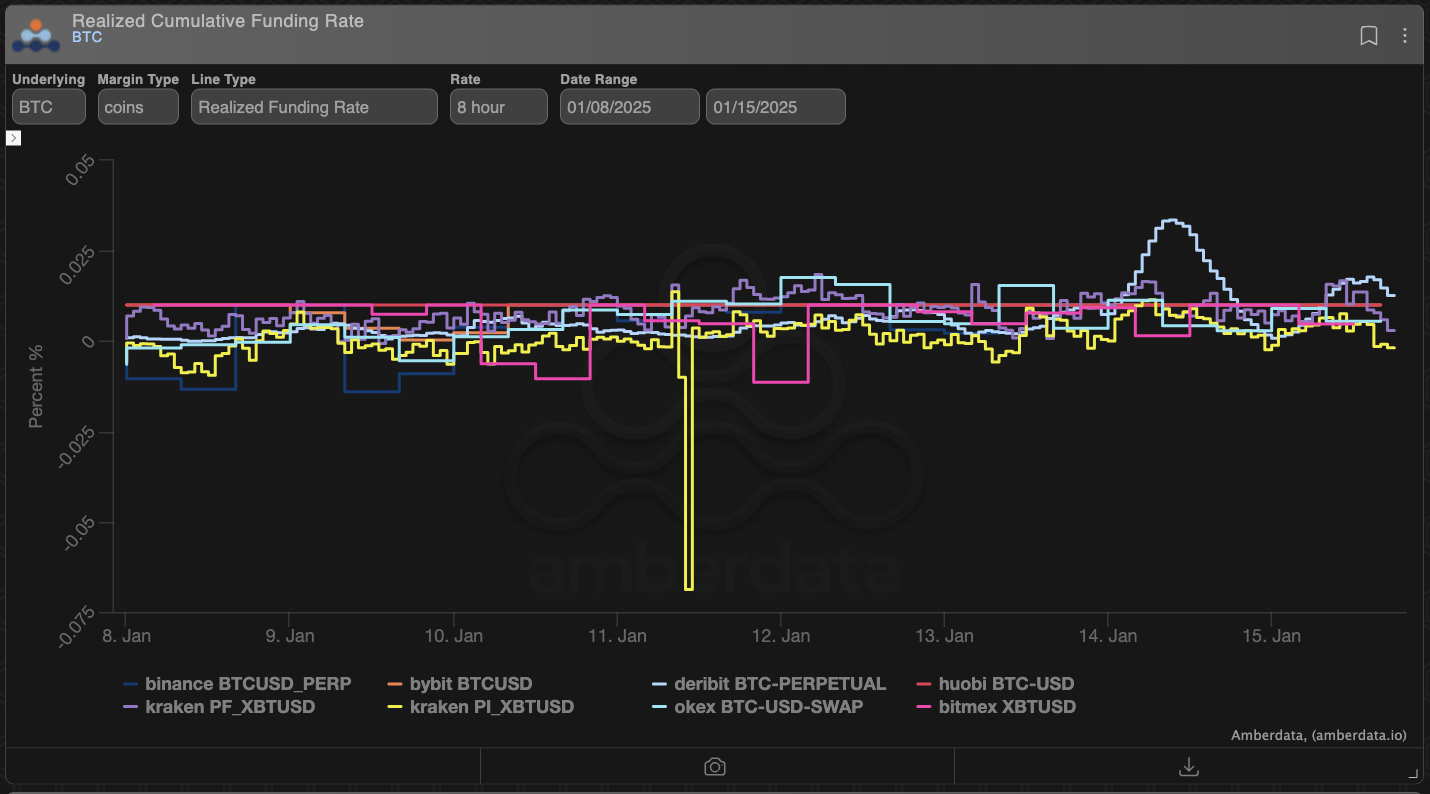
Another invaluable resource is the Realized Cumulative Funding Rate chart. By tracking how much you’ve effectively paid or received over a set period, you can gauge the net influence of funding on your PnL. If you notice that cumulative funding payments are eating away at any gains from price movements, it may be time to close, reduce your exposure, or switch from long to short (or vice versa).
Correlations Between Funding Costs, Price Volatility, and Trader Sentiment
Funding Rates and Market Positioning
When the crowd is fervently bullish, they’re more willing to pay a premium to stay long, causing funding rates to rise. Similarly, if the market consensus shifts to a pessimistic outlook, funding rates might dip into negative territory. These funding fluctuations serve as a real-time gauge of market sentiment.
Price volatility can compound these effects. In times of rapid price movements, traders might aggressively pile into one side of the market. If BTC or ETH is on a tear, for example, you’ll often see spike-like movements in the funding rate, reflecting a short-term surge in demand for long positions. This dynamic sometimes leads to “punitive” funding rates, which can cause overextended traders to reconsider.
Rolling 24H Volume and Liquidations
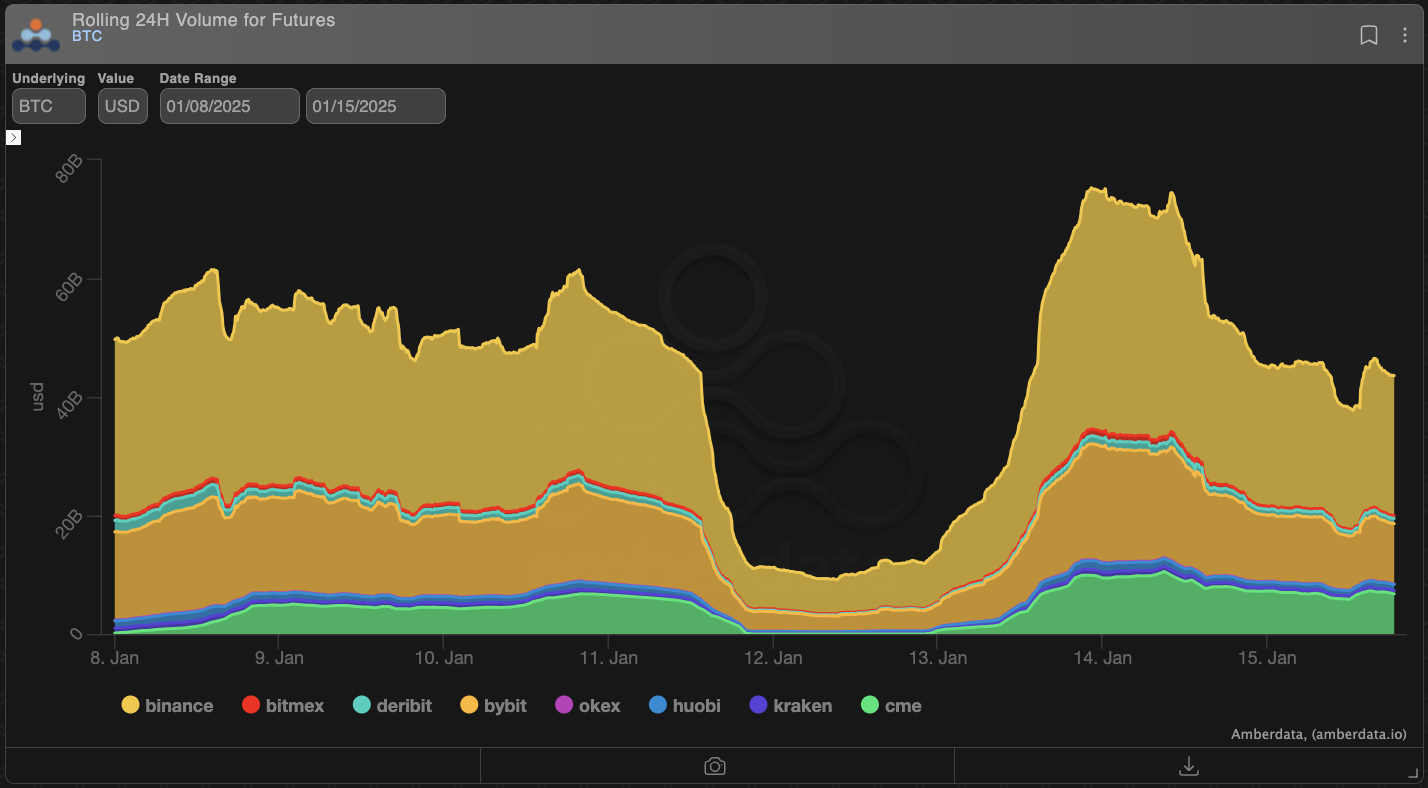
Another piece of the puzzle comes from Rolling 24H Volume for Futures. REDACTED’s volume metrics show you where activity is concentrated and help pinpoint when a particular exchange or asset is drawing a surge of new positions. If volume climbs sharply in conjunction with a rising funding rate, it suggests that bullish traders are piling in with high conviction. The opposite scenario—a negative funding rate plus reduced volume—might be a sign that the market is losing faith in an asset or that traders are stepping away due to uncertainty.
An additional consideration is the interplay between extreme funding rates and forced liquidations. While not shown here, a Total Liquidations chart can reveal whether stretched funding rates push leveraged positions to their breaking points. When mass liquidations cascade, it can reset or even invert funding trends as the market flushes out over-leveraged traders.
Optimizing Swap Strategies Using Funding Rate Patterns
Tactical Positioning Based on Favorable Funding
One of the most straightforward strategies is to choose your moment to go long or short based on the current and anticipated funding environment. If the funding rate is high and you expect it to remain elevated, taking a short position can mean you’ll collect regular payments, offsetting some potential downside risk if prices move against you. On the other hand, a strong bullish outlook with moderate or negative funding might create a highly attractive scenario for going long.
Cross-Exchange Funding Arbitrage
Not all exchanges set the same rates. By viewing REDACTED’s Realized Cumulative Funding Rate Comparison, you can see if some platforms consistently have higher or lower rates. In a convergent market, this difference may present an arbitrage opportunity: you could short on an exchange offering a high positive rate and go long on another with a neutral or negative rate, locking in a near risk-free advantage if the prices track each other closely.
This approach requires careful monitoring of each platform’s contract specifications, liquidity, and fee structures. Still, for sufficiently capitalized and agile traders, trading venue optimization can unlock additional yield that might otherwise go unnoticed.
Incorporating Market Sentiment and Volume Trends
Funding rates don’t exist in a vacuum. They reflect the interplay between price movements, open interest, volatility, and wider market psychology. Traders who align their strategies with both short-term funding flows and deeper market sentiment insights often gain an edge. For example, if REDACTED’s Predictive Funding Rate signals a shift from positive to negative while volume data also indicates declining participation, that combination could herald a change in trend—perhaps from bullish to neutral or bearish.
In some scenarios, layering funding rate patterns with more granular data on major support/resistance levels or on-chain transfer activities can give you a multi-dimensional view. This is particularly relevant if you notice that funding is about to spike just as the underlying asset is breaching a significant price threshold. The synergy of these factors can be the spark that moves markets sharply in either direction.
Using Perpetual Futures for Hedging
Lastly, the presence of predictive or realized funding rates can inform your hedging decisions. Suppose you’re a spot holder of Bitcoin and you notice a steep positive funding rate. By opening a short perpetual swap on an exchange with high funding, you not only hedge your downside risk but might also get paid for it (as longs will be paying the funding to shorts). This synergy, however, hinges on the rates remaining favorable. Should they flip negative, you’d need to reassess whether the hedge is still profitable or if you’ve inadvertently introduced new costs into your portfolio.
Conclusion
Funding rates play a pivotal role in shaping the cost structure of perpetual futures. They directly influence whether your long or short position is profitable over time—sometimes more so than the underlying price movement itself. Traders who keep a close eye on funding rates, analyzing both historical and forward-looking data, often have a tactical advantage in adjusting their positions before the funding environment shifts.
REDACTED’s suite of tools—Predictive Funding Rate, Realized Cumulative Funding Rate, and Rolling 24H Volume for Futures—can help you see exactly where market activity is heading and how your positions might be affected. By understanding the correlation between funding rates and other crucial factors such as trading volume, price volatility, and market sentiment, you’ll be better equipped to make timely decisions, optimize your position sizing, and even dabble in cross-exchange arbitrage opportunities.
Staying on top of funding patterns is essential, especially in the 24/7 world of crypto. Whether you’re looking to secure yield from high funding, mitigate fees when rates become punitive, or simply hedge an existing spot position, a grasp of these dynamics can make or break your profitability. By integrating this knowledge with other analytics—from open interest data to broader sentiment indicators—you’ll have a robust framework for navigating the ever-evolving landscape of perpetual swaps.
