Share this blog:

USA Week Ahead:
-
Monday - Fed Members Speak
-
Wednesday 8:30a ET- PPI
-
Wednesday 2pm ET- FOMC Minutes
-
Thursday 8:30a ET- CPI
Disclaimer: Nothing here is trading advice or solicitation. This is for educational purposes only.
Authors have holdings in BTC, ETH, and Lyra and may change their holdings anytime.
![]()
CRYPTO OPTIONS MACRO THEMES:
Long-term rates are being affected heavily due to the resilient job market and surprise “JOLTS” & NFP reports last week.
Together, the market seems to be waking up to the idea that rates might actually be “higher for longer”.
This has sent the US dollar rallying against other fiat currencies and precious metals. BTC however has remained very resilient. A bullish sign.
Chart: (US Treasury Yield curve month-over-month)

This week we have PPI, CPI and FOMC minutes released. On Monday, we also had Fed speakers suggest that the organic reaction to long-term rates moving higher, could erase the need for future rate hikes.
Any dovishness in reaction to the bond market sell-off will be well received by risk assets. It will be telling to see if BTC reacts favorably to dovishness or shrugs that off too.
Clarity around inflation from PPI and CPI readings are the big events this week, with hopefully some insights from FOMC minutes regarding the probability of rates hikes finally being done now.

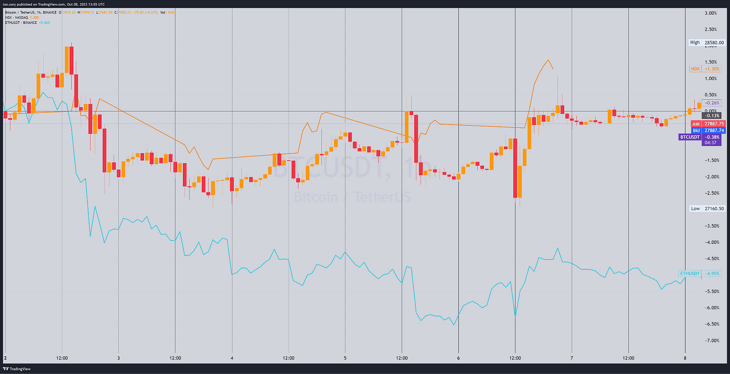
BTC: $27,602 (+0.2% / 7-day)
ETH :$1,578 (-4.9% / 7-day)
Chart: (YTD Spot Performance: BTC→“orange” & ETH→“blue”)
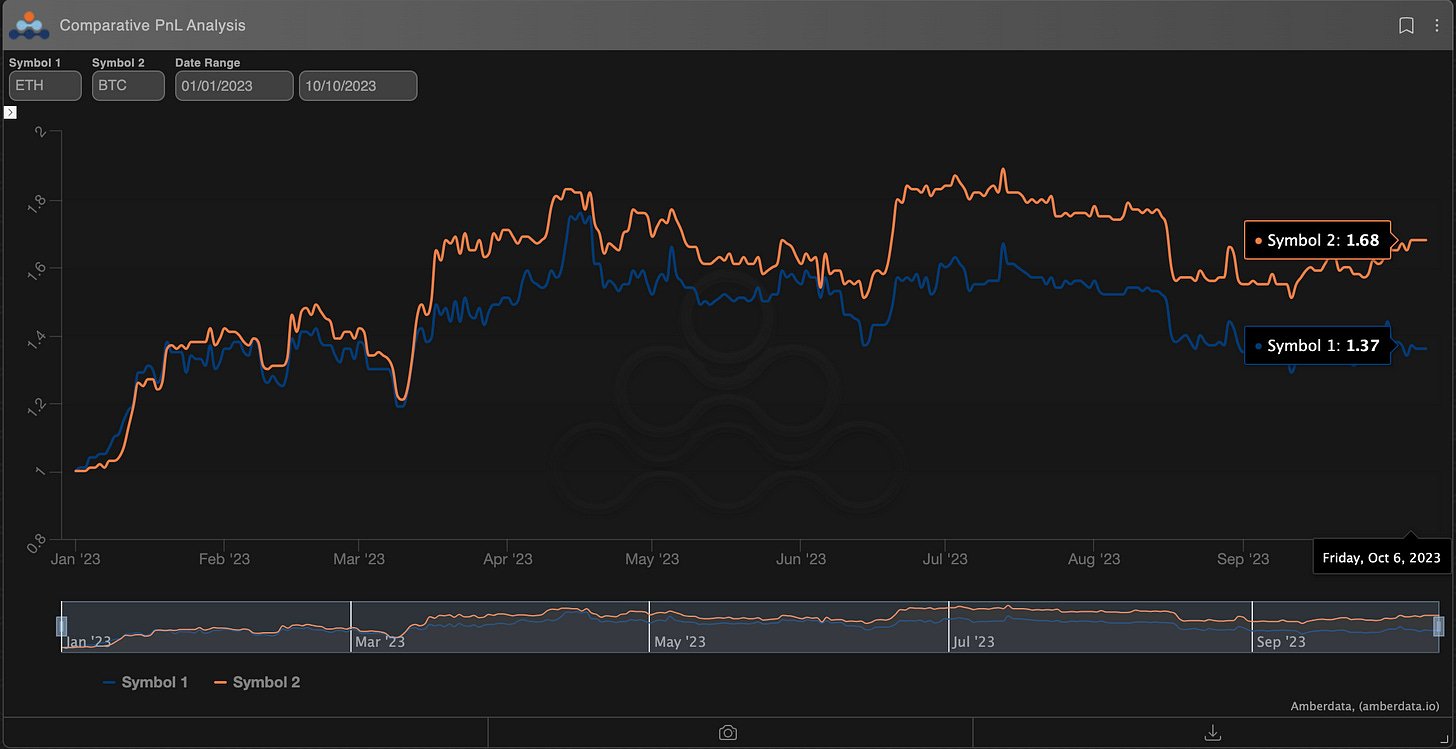
YTD we’ve seen an outsized performance in spot price returns for BTC over ETH.
BTC has returned +68% while ETH has returned +37%. The biggest driver of the deviation between both assets seems to have arisen as a response to the SVB banking crisis.
YTD BTC has traded as a macro asset while ETH has traded as a crypto specific asset.
This has also caused the relative volatility premium to lie with BTC, not ETH, except during downward momentum.
As crypto prices retraced lower, ETH has tended to move high in volatility.
So where is there opportunity?
Fundamentally speaking, I think there’s more headwinds for ETH over BTC going forward.
-
If ETH is the crypto tech stock and BTC is crypto gold, the higher rate environment we currently see in the macro landscape will have an outsized impact on the “long duration” tech stock. Digital gold also is hurt by higher rates, but a bid is found in response to global fiat uncertainty and geopolitical risk.
-
BTC enjoys the “commodity” asset category while ETH remains unclear. This crypto sector regulatory issue has a much higher impact on ETH. Even if ETH is deemed a “commodity” the DeFi projects built on TOP of ETH are subject to regulatory scrutiny. If DeFi usage drops in response to regulation, then EIP-1559 Ultrasound money narrative suffers, due to lower usage. The terminal value of ETH is greatly affect by the future of it’s issuance rate flipping from net burn, to net issuance.
Chart: (BTC ∆25 RR-SKEW)
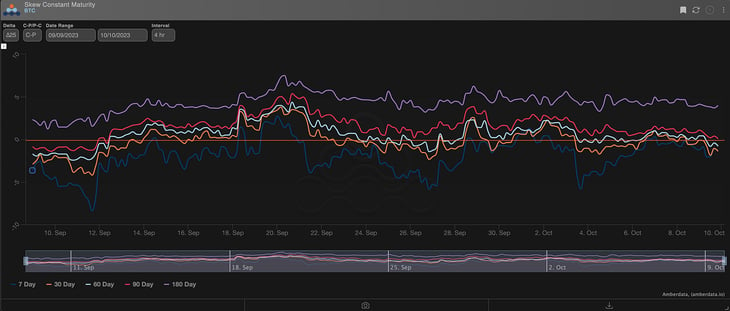
Chart: (ETH ∆25 RR-SKEW)
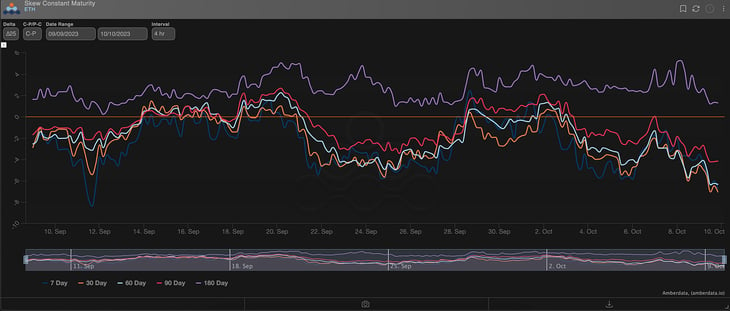
Looking at the RR-SKEW we can see option pricing is tilted more to downside volatility for ETH, but long-term +6mo options have a positive RR-Skew for both assets.
This can be interesting for buying downside protection on ETH, while holding upside BTC coin. A relative vol. synthetic straddle type of trade.
Could be interesting.

PROPRIETARY “GVOL-DIRECTION” FLOWS - @Gravity5ucks
Flow for Bitcoin dominated by blocks.
Chart: (BTC Options Scanner Top Trades)
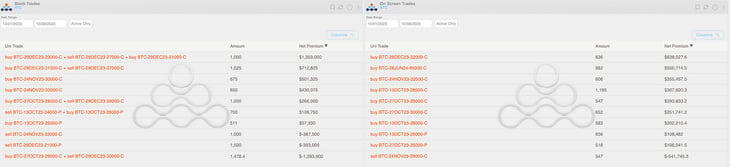
For December we can observe the substantial butterfly $23k-$27k-$31k and the long call-spread $31k-$37k.
The accumulation of long-naked-call on November continues.
The roll-up forward of short call (buy-to-close October and sell-to-open December) highlights a net premium received of $1.3M.
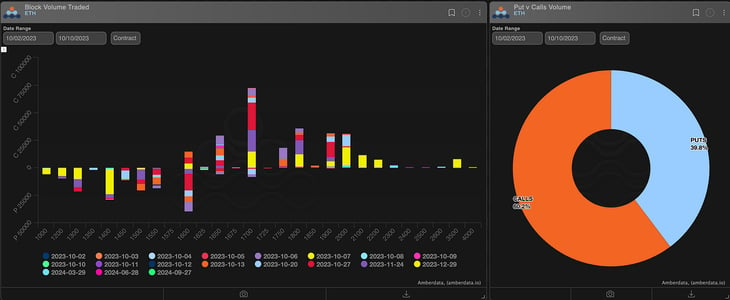
On Ethereum, the flow has been dominated by trades executed on-screen.
Chart: (ETH Options Scanner Top Trades)
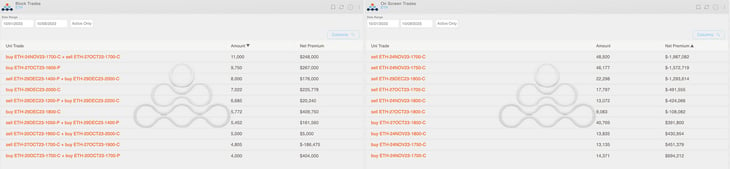
Comparing the BTC flow (moderately bullish) with the incessant and massive selling of ETH calls in the $1.7k-$1.8k range, it effectively confirms the almost negligible enthusiasm in the spot relative performance vs Bitcoin, with the ETH/BTC pair at its lows since July 2022.
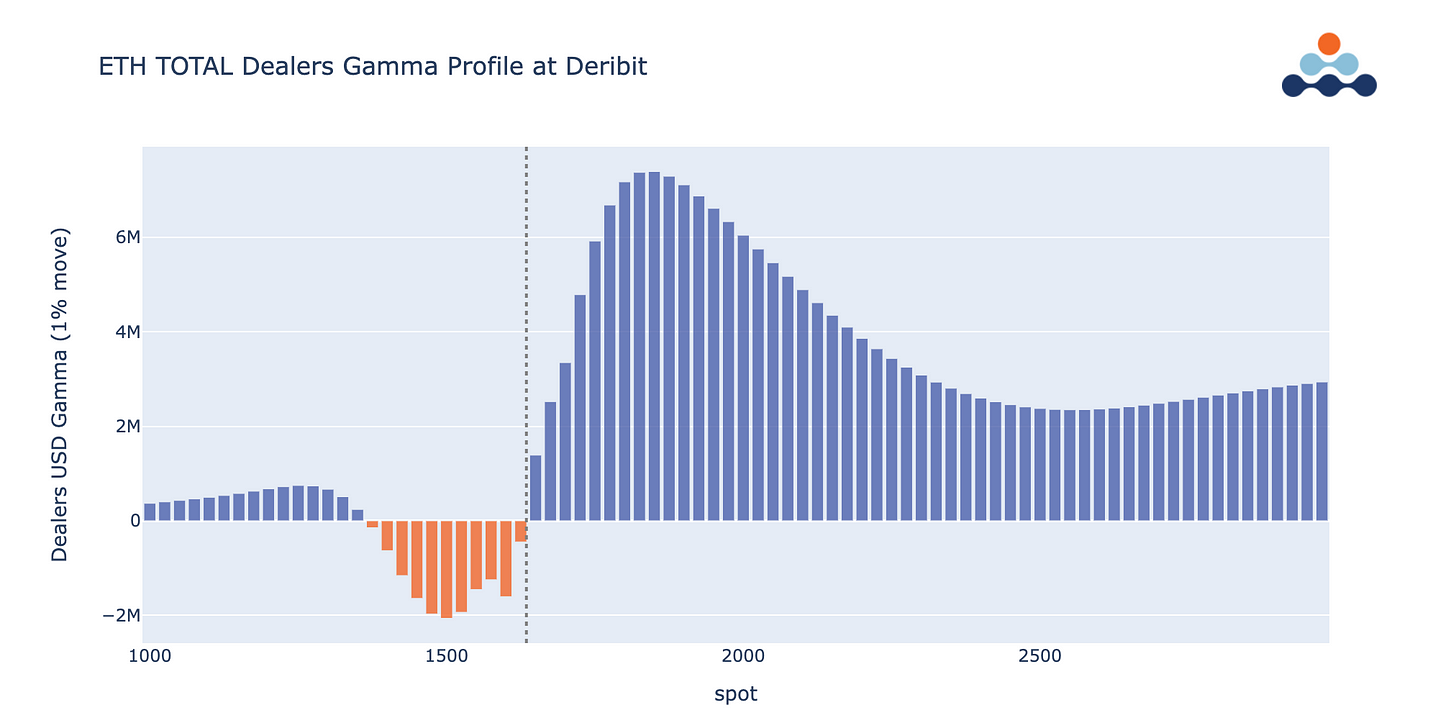
The positioning of BTC traders versus ETH is well summarized by examining the specular exposures of dealers' inventory.
As we have already highlighted elsewhere, this divergence can generate interesting dynamics within the Deribit ecosystem.
Chart: (BTC Gamma Profile)
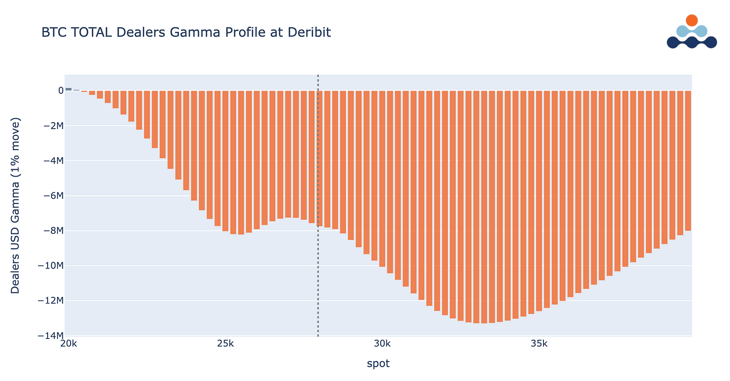
Chart: (ETH Gamma Profile)
For more insight here:
 | Twitter")
Paradigm's Week In Review
🚀 Uptober? Cryptos began the month with a bang - a +3% surge in just minutes... But the dog's reaction says it all.
🕵️♂️ Curious about the institutional crypto #options traders this week? Dive into the details below!👇
🙅♂️📉 The week wrapped up with $BTC remaining steady, $ETH down by ~5%, and NDX +1.3%
📈 This week’s flow reveals some traders positioning for potentially reduced Dec volatility and others are buying upside in Nov & Dec.
$BTC Options Flows 🌊
📈 This week’s flow reveals some traders positioning for potentially reduced December volatility and others are buying upside in Nov & Dec.
1️⃣1500x 29-Dec-23 21k Put SOLD (Deltas Hedged)
2️⃣ 1025x 29-Dec-23 31k/37k Call Spread BOUGHT
3️⃣ 1000x 29-Dec-23 23k/27k/31k Call Butterfly BOUGHT – Predicting price stability around 27k.
4️⃣ 1000x Oct 28k / Dec 36k Call Calendar SOLD (Deltas Hedged) – Time decay or vol play.
5️⃣ 675x 24-Nov-23 30k Call BOUGHT
$ETH
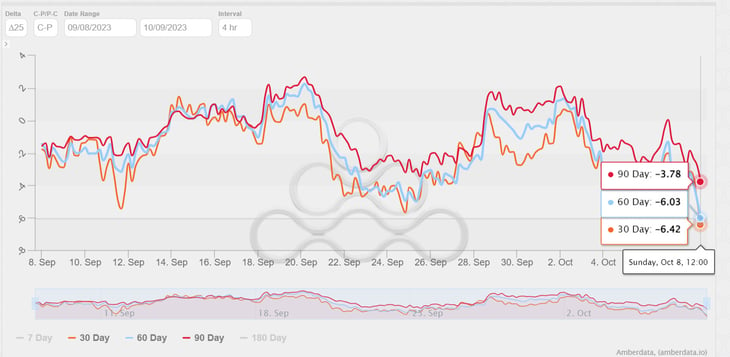
📈 This week’s flow reveals buyers of Calls via risk reversals and outrights. Put skew has steepened, reaching its 30-day low.
Chart: Put Skew (25d Put - Call)
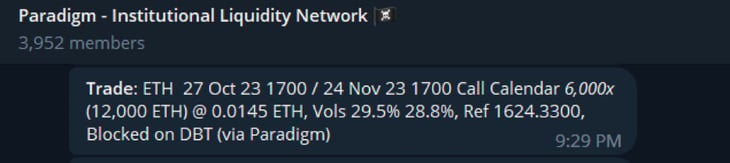
$ETH Options Flows 🌊
1️⃣ 11000x 27-Oct-23 1700 / 24-Nov-23 1700 Call Calendar bought (😮0.7 vol spread, see attachment)
2️⃣ 8000x 29-Dec-23 1400/2000 (Deltas Hedged) Bull Risk Reversal bought
3️⃣6000x 29-Dec-23 1200/2200 Bull Risk Reversal bought
4️⃣ 5100x 29-Dec-23 1800 Call bought
Hit us up on Telegram! 🙏
Daily Commentary✍️ http://pdgm.co/edge
24/7 Support: http://pdgm.co/tgsupport
Sign up now! 👉 https://pdgm.co/3BLEw1Y
Bybit x Paradigm Futures Spread Trade Tape:
https://t.me/paradigm_bybit_fspd
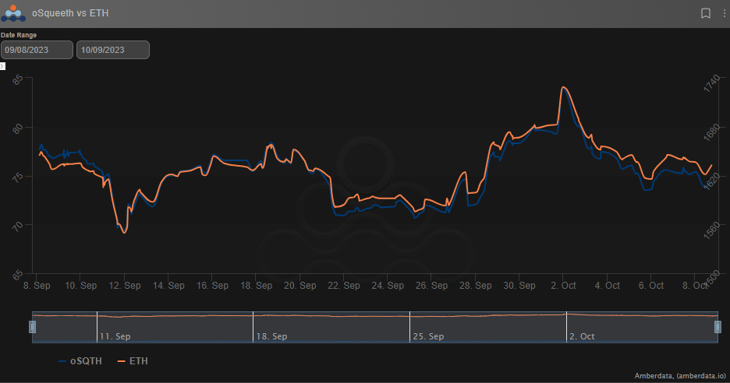
Chart: BTC
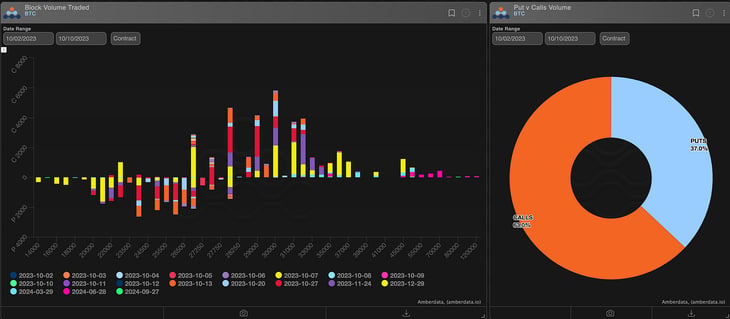
Chart: ETH

Crypto markets found their way higher throughout the week. ETH ended the week -2.93%, oSQTH ended the week -6.05%.
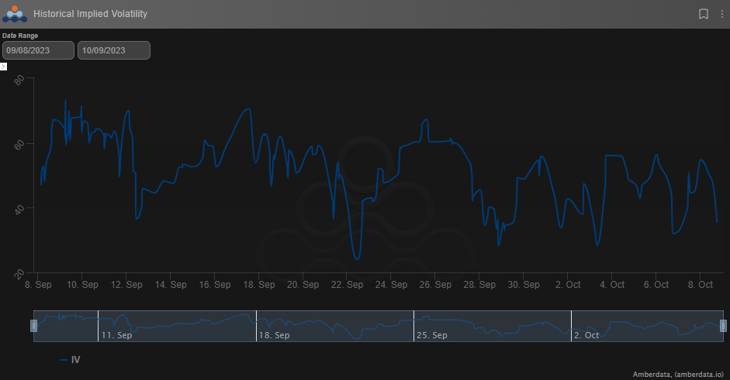
Volatility
oSQTH IV remains active finding a floor in the low 30s and a ceiling in the high 50s.
Volume
The 7-day total volume for oSQTH via Uniswap oSQTH/ETH pool was $311.91k
October 3rd saw the most volume, with a daily total of $119.9k traded.
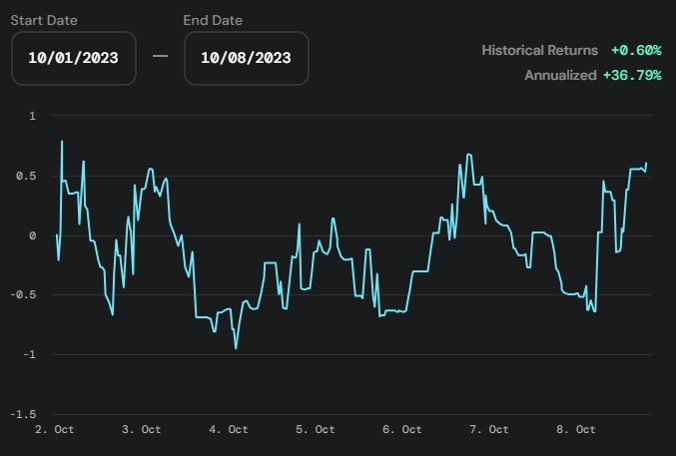
Crab Strategy
Crab saw gains during the week ending at +0.60% in USDC terms.
Twitter: https://twitter.com/opyn
Discord: discord.gg/opyn
AMBERDATA DISCLAIMER: The information provided in this research is for educational purposes only and is not investment or financial advice. Please do your own research before making any investment decisions. None of the information in this report constitutes, or should be relied on as a suggestion, offer, or other solicitation to engage in, or refrain from engaging, in any purchase, sale, or any other investment-related activity. Cryptocurrency investments are volatile and high risk in nature. Don't invest more than what you can afford to lose.
