Share this blog:
The story behind the metrics for Uniswap, Sushiswap, and more! Today’s post will cover the deep details about activities behind the popular decentralized exchanges.
Quick back story for those new to DeFi & DEX
The past year has seen tremendous growth in decentralized finance, where organizations, individuals & professionals can establish trade on the Ethereum blockchain without any intermediaries and across borders. What started out as a small niche product, quickly turned into an institutional level asset trading protocol within a few months. Uniswap, a decentralized exchange, created a simple trade protocol that incentivized automated market makers (AMM) to enable trade for any digital assets. Sushiswap (now sushi.com!), took the market by storm using the first massively successful fork attack (copy-cat of Uniswap code) and quickly innovated on top of existing features to appeal to AMM providers. Quite a few others worth mentioning that I won’t deep dive into this post (but in the next DeFi post!): Curve.fi, Balancer, Compound, AAVE, 1Inch.exchange — this year was jam-packed with DeFi growth!
Big picture: Uniswap vs Sushiswap Metrics Analysis
What does the data tell us about usage & growth in decentralized exchanges? Which exchange protocols have seen the most trade volume & activity?
Let’s start with Total Value Locked — the main metric most associated with “success” of DeFi protocols. The term can be defined as:
Total Value Locked: The amount of liquidity in digital assets that are wholly owned by a smart contract, and are for some duration of time immovable.This is similar to how centralized exchanges hold collateral, to back trade.
Taking a snapshot of data starting at the point where Sushiswap began (09/09/20), and Uniswap had its main growth spurt, we can clearly see some interesting activity:
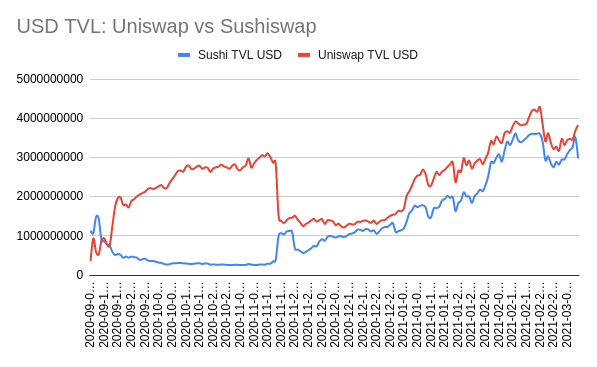
This chart clearly shows Sushiswap take over in TVL for a few days, and then Uniswap jumps ahead again. A little context: Uniswap, in order to maintain the largest protocol position, launched a community token (UNI) to incentivize liquidity providers & traders to use Uniswap. Then a few weeks later, Sushiswap also launched a similar token (SUSHI), which you can clearly see takes some of the total liquidity but then stagnates.
Another KEY thing to notice in this chart — both protocols TVL appears to increase proportionally midway in the chart. This is because the TVL is represented in USD, which is affected by the incredible market growth of Bitcoin & Ether starting last November. To get a better “unbiased” view of the growth, here is a chart of wrapped Ether liquidity:
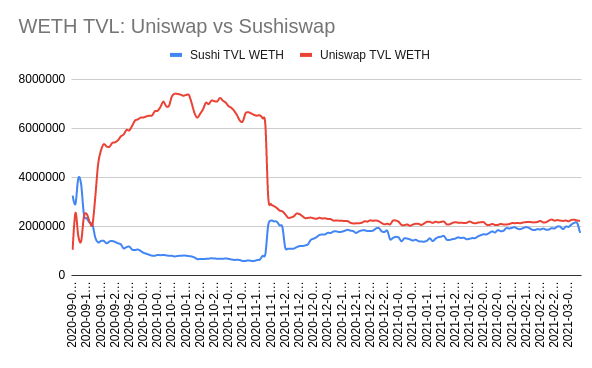
Now we can see the scale of true liquidity, as the proportion of actual assets unaffected by market valuations. It’s interesting to see how both protocols stagnate around November as well… Why is this?
FEES!
Blockchains (PoW chains that is) are economically based on their native asset for fees. So when a protocol like Uniswap has transactions for trades, the end user must pay in the network asset. The popularity of DEX protocols, DeFi products & market hype drove transactions and activity to a new high. This was then exponentially affected by front-running bots to arbitrage price opportunities… Effectively, the entire blockchain became the playground of whales (large sum traders), which drastically stifled everyday users activity.
Regardless, DEX protocols continued to grow in other ways, a quick look at the cumulative deployed assets shows some growth:
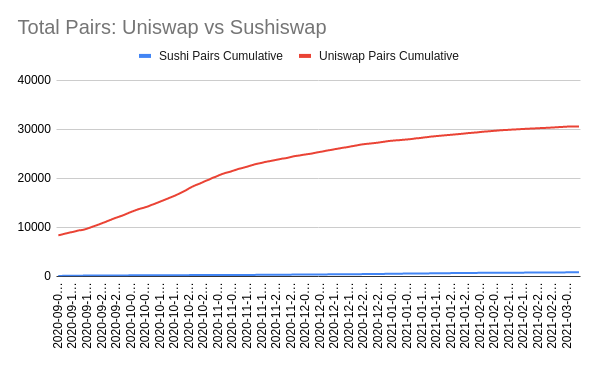
Now, the comparison here looks bleak for Sushiswap, however its worth noting — sushiswap assets are more focused on a smaller set of assets that the sushi.com community prefers. Where Uniswap is completely focused on an open market where anyone can provide liquidity for any asset for it to be tradable. This means there are many assets that are rarely traded on Uniswap.
Protocol Utility: How Much Trade Is Really Happening?
Given the samples above, you might be thinking: If fees are too high, no one is trading anymore.
This is not the case! Looking at trades & amount of assets (pairs) traded, we can clearly see some exciting amount of activity:
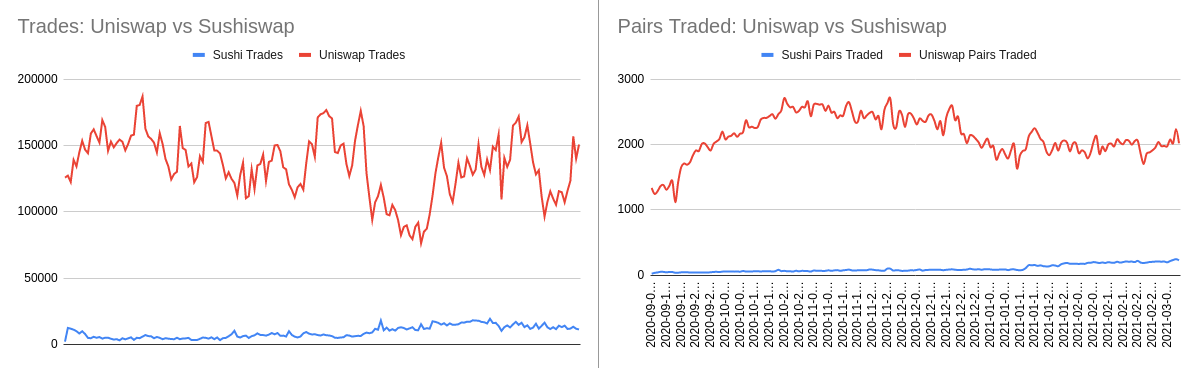
Both protocols maintain a large amount of trade, and are growing at a steady rate. Uniswap is again much higher in numbers of trades and pairs trading, which is a little bit misleading given the larger amount of assets deployed on Uniswap. It is important to see both metrics side-by-side, because even though there are lots of trades and assets on Uniswap, you can see the cumulative activity is still significantly higher than sushiswap.
To better understand protocol activity, we must drill into a finite example of a popular asset, available and traded on all DEX protocols:
DAI_WETH: A Key DEX Asset Pair
The popular asset DAI (a stablecoin based around USD) combined with WETH (wrapped Ether) enables many dApps (decentralized applications) and other protocols to give users easy-to-comprehend and less volatile assets. Almost all DEX and DeFi products utilize DAI_WETH in some way, so it’s important to look at the activity and growth of this pair.
Here’s DAI TVL —
![]()
Notice the change here? DAI TVL grew a lot while the high fees and market value were sky-rocketing. Since DAI is a stablecoin, the market valuations are slightly skewing the perspective here, but since the chart above is based on DAI units its still valid to look at. Final interesting note: Sushiswap takes over in TVL a few weeks ago — indicating an interesting change in trade preference.
Taking a look at the proportions of both protocol trade & volume, the story becomes more interesting:
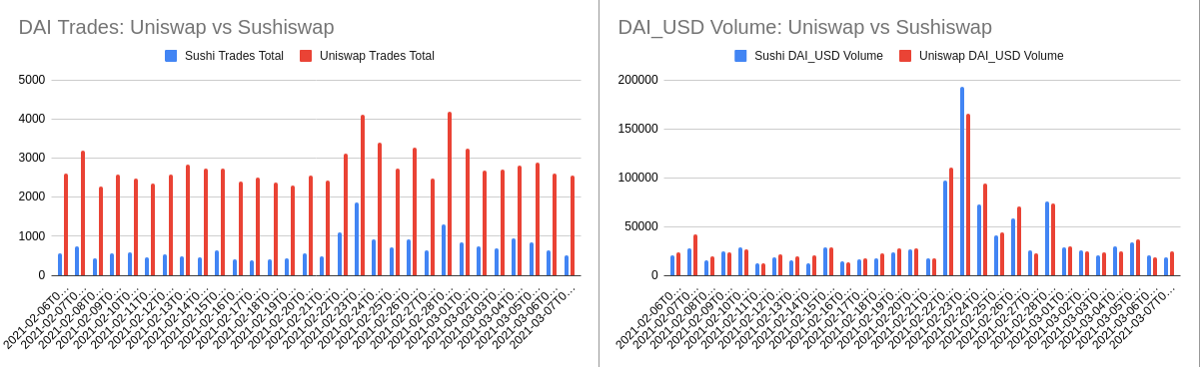
DAI trade is following closely on sushiswap, holding a 20–40% margin of trade compared to Uniswap. It gets even closer when compared to USD volume — Sushiswap is on par or exceeding that of Uniswap… Are the tides turning on protocol utility and preference?
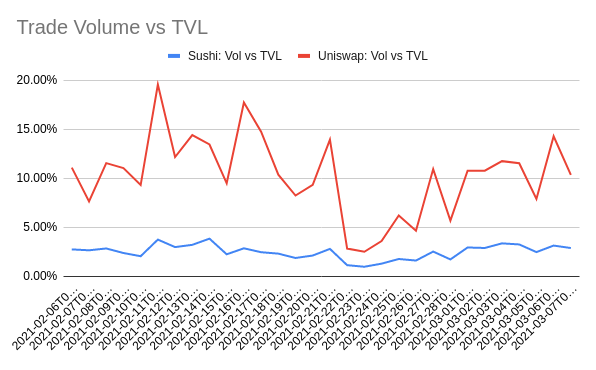
This chart shows the comparison of trade volume against total value locked. Uniswap is still the clear winner, but what is unclear is if that is skewed because of having more assets to trade or if Uniswap can simply outperform other protocols by being so open.
What about fees versus slippage?
I mentioned fees above, and its worth inspecting the effects of fees — and more specifically slippage — on trade activity.
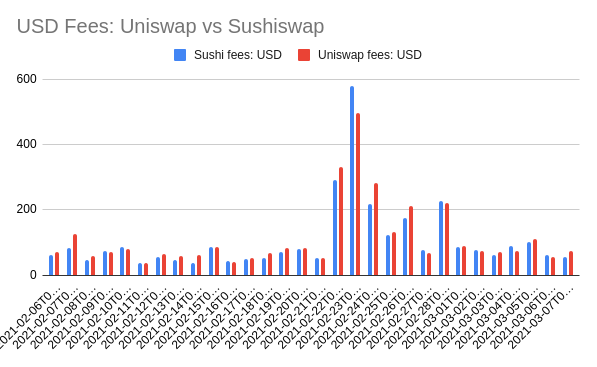
Uniswap base fee is 0.03%, which goes directly to the liquidity providers, this is the same fee structure for sushiswap, USD fees look almost identical:
Slippage, in the context of DEX can be defined as:
Slippage: Trade total fee - Trade base feeAn quick example:
0.03 (base LP fee) - 0.00298957395 (total fee) = 0.00001042605043While that might not look like a lot, that’s the slippage of small trade fees shifting within the same block as another same asset pair. This type of trade will go through, since you can set the trades to have a slippage margin of less than 3 or 5%.
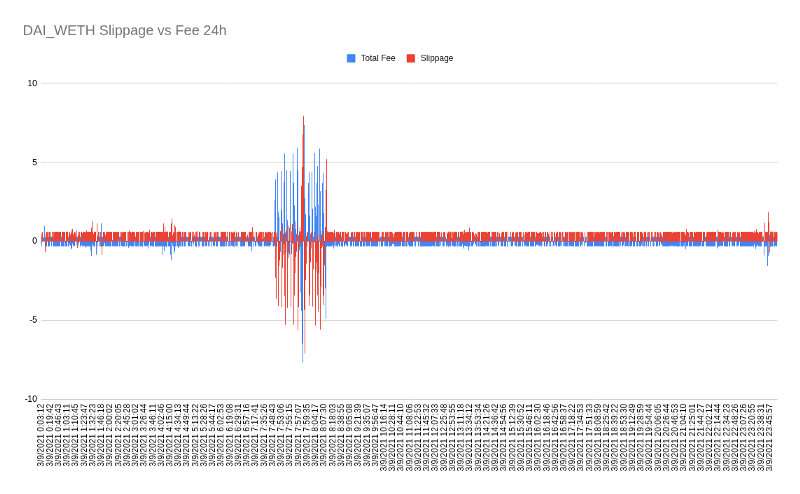
Comparing the fees to slippage, you can see most times fees are equal to slippage, however within some blocks similar asset trades are affected by slippage. In some circumstances this is caused by front running bots gaming the system to arbitrage price, which allows them to make a profit on the extra slippage.
Slippage is important to pay attention to, because arbitrage and specifically price are set by the automated market makers — in essence, the AMM Liquidity Providers are King when it comes to DEX. They are the real winners of DEX. There are even cases where the initial liquidity provisioning of a new asset pair causes massive volatility until the price reaches equilibrium. This is the major profit window for LPs.
Minor note: I wanted to dive into LP Rug Pulling, however that would be another large blog post in itself. It’s definitely a topic worth investigating with Amberdata APIs! :D
Gas Prices are so HIGH!
The most common question I have seen: Where can i get the most value for a trade?
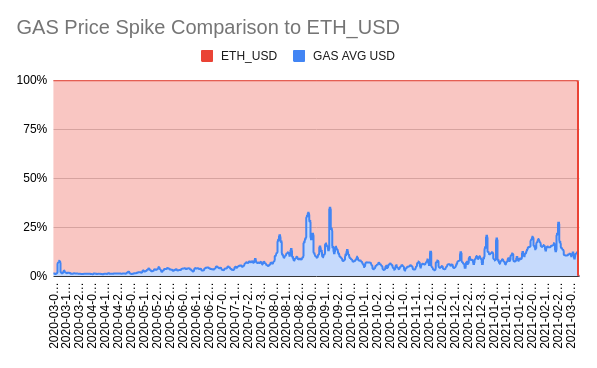
Unfortunately, this is not simple, as the network activity really causes timing to be the greatest factor in choosing the best time to trade. See how the market caused gas prices to soar — these averages are not something most people want to pay, starting at a modest $2.88 and maintaining a recent average of $228.85.
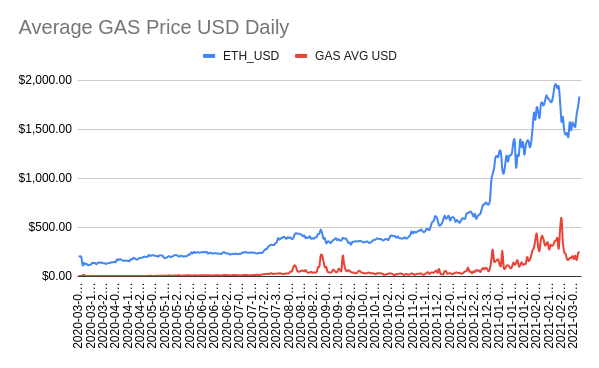
As with the graphs above, its better to look at the actual cost without market fluctuations, here we can see how GAS is indeed increasing over time (even with some network spikes):
Conclusion
These are some exciting times for DEX & DeFi! This is certainly a space worth following, as there is much innovation happening and value flooding in. If there’s anything you can take away from this post, its the following:
- DEX & DeFi are exploding in growth, pushing the limits of Ethereum
- Open AMM Models are the highest growth of decentralized exchange protocols
- Fees are super high, but protocols are innovating to keep them low
Data & Research used Amberdata.io APIs
Get started free at amberdata.io →
Secret Sauce:
- ALL of the charts were generated using google sheets (I bet you could tell from the design style ;) )
- ALL of the charts used Amberdata.io REST endpoints
- I used the feature format=csv to quickly save all responses in a csv file for easy importing into google sheets. You can read how to do the same thing in my other blog post about CSV formatting →
Featured Endpoints:
- Exchange Metrics Latest: https://docs.amberdata.io/reference#dex-metrics-exchanges-latest
- Exchange Metrics Historical: https://docs.amberdata.io/reference#dex-metrics-exchanges-historical
- Pair Metrics Latest: https://docs.amberdata.io/reference#dex-metrics-pairs-latest
- Pair Metrics Historical: https://docs.amberdata.io/reference#dex-metrics-pairs-historical
- Asset Metrics Latest: https://docs.amberdata.io/reference#dex-metrics-assets-latest
- Asset Metrics Historical: https://docs.amberdata.io/reference#dex-metrics-assets-historical
Supplemental Endpoints:
- Transaction Metrics: https://docs.amberdata.io/reference#transactions-metrics-historical
- Spot OHLCV: https://docs.amberdata.io/reference#get-historical-ohlc