Share this blog:
Stay updated on the crypto events in October, from the SBF trial revelations to tokenized BlackRock shares. Explore market trends, DeFi developments, and network comparisons in the latest Crypto Snapshot!
Here is a short recap of what’s happened:
- The Sam Bankman-Fried (SBF) trial has been revealing how the titanic exchange sank. Some surprising and not-so-surprising reveals: despite claiming FTX and Alameda were independent, SBF actively oversaw both and dipped funds across both companies regularly. SBF also stole billions of dollars in FTX customer funds, as testified by Caroline Ellison, former CEO of Alameda Research. Given the gravity and ripple effects FTX has had on the crypto ecosystem, many are interested to see what punishment lies in store for SBF. If convicted, the maximum prison sentence could be up to 110 years. Saving the best reveal for last, the prosecution showed that the insurance fund FTX had for customers was just a random number generated via Python script.
- JP Morgan debuts tokenized BlackRock shares as collateral with Barclays. This is JP Morgan’s first time using a blockchain-based collateral settlement transaction. The transaction took place on Onyx, JPM’s Ethereum-based proprietary network. Tokenization of TradFi assets is a major win for the crypto community – even if it takes place on a network antithetical to crypto’s decentralized identity.
- The Wall Street Journal released a report indicating that Hamas has received millions in funding via cryptocurrency. Despite the articles’ timely reports, this story has been published several times over the previous years. Though the report says it is a marginal amount relative to other state-funded sponsoring, we will likely see crypto as part of the OFAC sanctions that the U.S. is considering in response to the attacks last week.
Crypto Spot Market
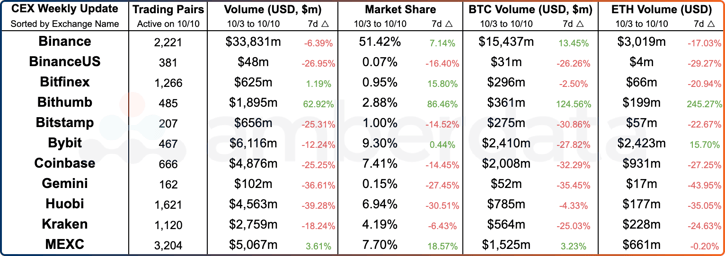
Centralized Exchange (CEX) comparisons from weeks 10/03/2023 and 10/10/2023.
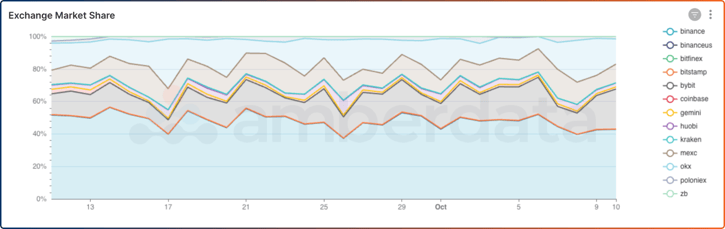
Centralized Exchange (CEX) trading volume market share over the last 30 days.
After a steep plunge in market share over the past two weeks, Binance has started to restabilize its position and holds around 43% of the market. Bybit has made significant gains in market share, moving from 13% to 25% market share in the past two weeks. OKX saw a sharp decline in market share these past few days, dropping 26% to 13%.
Maintaining a dominant position in this bear market is vital for centralized exchanges. When capital is not readily available, smaller exchanges may struggle to maintain an identity. Movement among the major exchanges gives us insight into who will come out on top in the future bull market.
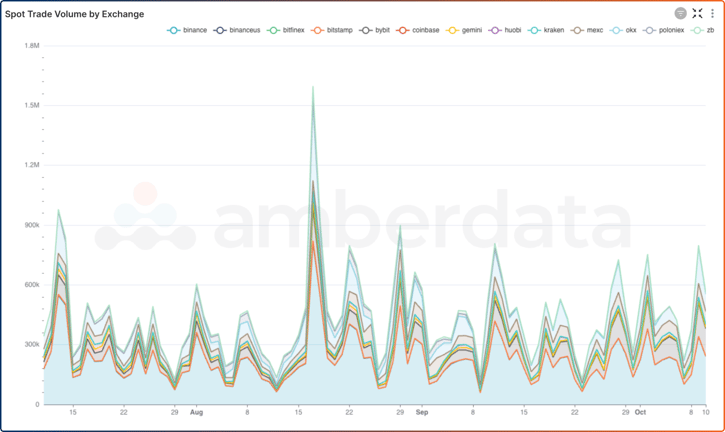
Centralized Exchange (CEX) trading volumes over the last quarter.
Despite the uncertain future of centralized exchanges due to legal challenges, trading volume remains steady, with peaks of approximately 1 million in trading volume each week. This is good news for many CEXs, as they struggle with user retention in this uncertain economic environment. With recent geopolitical events hitting a turning point, it will be interesting to monitor how CEX trading volume reacts.
DeFi DEXs

Decentralized Exchange (DEX) protocol from weeks 10/03/2023 and 10/10/2023.
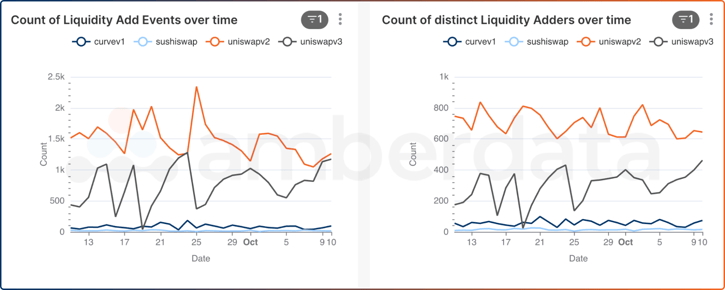
Decentralized Exchange (DEX) added liquidity over the past month.
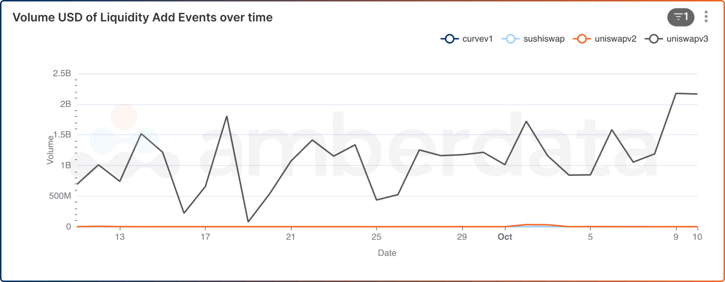
Decentralized Exchange (DEX) added liquidity volume over the past month.
Uniswap V3 has seen an increase in liquidity over the past two weeks. Interestingly, these increases seem to be from distinct addresses, as the peaks and valleys in liquidity added addresses sync up with the number of liquidity add events. We also see that DEX's added liquidity volume for Uniswap V3 has jumped to more than $2B. Volume on other DEXs is minuscule compared to Uniswap V3, marking it as the clear king of the DEX space.
DeFi Lending/Borrowing
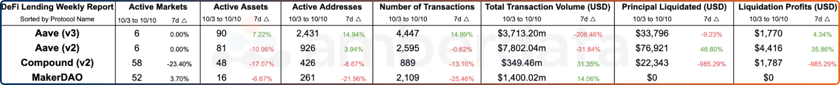
DeFi Lending protocol comparisons from weeks 10/03/2023 and 10/10/2023.
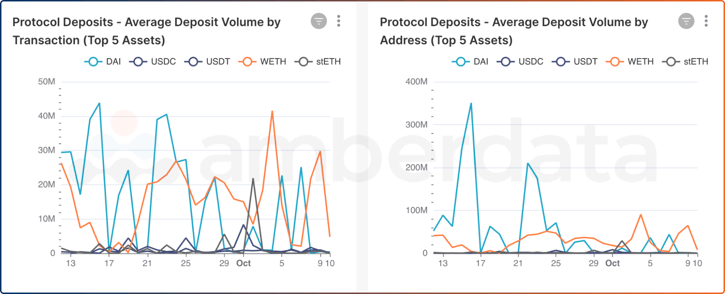
DeFi Lending protocol deposits from top 5 assets during the last 30 days.
Deposit volumes for the top five assets on Lending protocols indicate a definite decline since early October. WETH temporarily rebounded to new highs but has since fallen to early September levels. The average deposit volume by address has declined significantly, with Dai being the most noticeable. Lower value deposits are usually indicators of non-profitable yield from protocols, making it likely that depositing is not beating out impermanent loss. We will likely see this trend continue throughout the rest of the year unless something significantly incentivizes yield farmers.
Networks
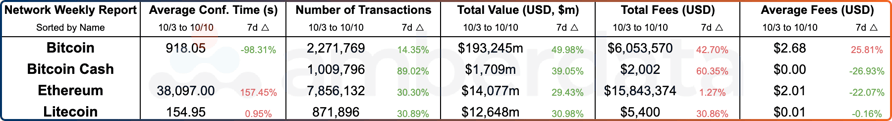
Network comparisons from weeks 10/03/2023 and 10/10/2023.
Network transaction comparisons from weeks over the last year.
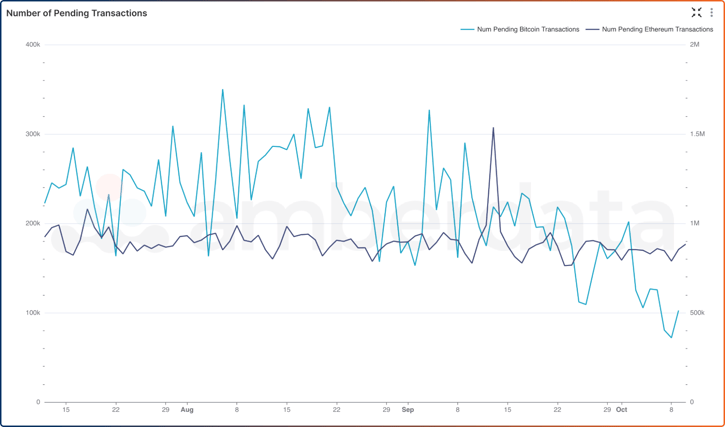
Pending mempool transactions are a great metric to gauge how active the network is. Pending transactions indicate how many transactions are in the queue on a given day, which lets us evaluate how many users are sending transactions on-chain. Over the past month, the number of pending transactions for Ethereum has steadily decreased on average since August. One possibility is that most of ETH’s transactions are moving to L2s, thus reducing the amount of activity on the L1. Bitcoin, largely seen as a store of value, remains fairly consistent with its pending transaction count.
Links
Recent Coverage
- Amberdata’s second stablecoin primer: Becoming an Over-Collaterized Stablecoin Maxi
- Amberdata and Infotrend Partner to Support SEC Blockchain and Digital Assets Data Contract
- Amberdata Perpetual Futures Primer: Exploring Crypto Perpetual Futures
- Cryptonomist: Honda accepts crypto payments like Ripple and Dogecoin
- Coindesk: Bitcoin Sinks Nearly 3% to $26.7K; Bulls Ponder How Low It Can Go
Spot Market
Spot market charts were built using the following endpoints:
- https://docs.amberdata.io/reference/market-metrics-exchanges-volumes-historical
- https://docs.amberdata.io/reference/market-metrics-exchanges-assets-volumes-historical
- https://docs.amberdata.io/reference/get-market-pairs
Futures
Futures/Swaps charts were built using the following endpoints:
- https://docs.amberdata.io/reference/futures-exchanges-pairs
- https://docs.amberdata.io/reference/futures-ohlcv-historical
- https://docs.amberdata.io/reference/futures-funding-rates-historical
- https://docs.amberdata.io/reference/futures-long-short-ratio-historical
- https://docs.amberdata.io/reference/swaps-exchanges-reference
- https://docs.amberdata.io/reference/swaps-ohlcv-historical
- https://docs.amberdata.io/reference/swaps-funding-rates-historical
DeFi DEXs
DEX charts were built using the following endpoints:
- https://docs.amberdata.io/reference/defi-metrics-exchanges-historical
- https://docs.amberdata.io/reference/defi-liquidity-historical
DeFi Borrow/Lend
DeFi lending charts were built using the following endpoints:
- https://docs.amberdata.io/reference/defi-lending-protocol-lens
- https://docs.amberdata.io/reference/lens-protocol-makerdao
- https://docs.amberdata.io/reference/lens-protocol-compound
