Share this blog:

Amberdata’s market intelligence platform, AmberLens offers Ethereum Network Supply Metrics derived from Blockchain network data, providing critical insights into market dynamics and trends. This data helps investors, stakeholders, and crypto data enthusiasts understand the health, activity, and mechanics of Ethereum, offering a significant edge in navigating the complexities of the ETH market. For institutional investors and financial analysts, leveraging this data is critical to assessing the stability and potential of digital assets.
Ethereum Supply Dynamics
The historical Ethereum circulating supply chart highlights critical insights into the network's evolution, particularly post-September 2022 following the Ethereum "Merge." This event transitioned Ethereum from a Proof of Work (PoW) to a Proof of Stake (PoS) blockchain, burning ETH fees and transforming ETH into a deflationary asset. The flattening of the supply curve post-merge indicates the stabilization of ETH issuance, which has significant implications for understanding long-term supply trends. The deflationary nature of ETH post-merge suggests a reduction in future supply, potentially increasing scarcity and impacting market dynamics by exerting upward pressure on ETH prices.
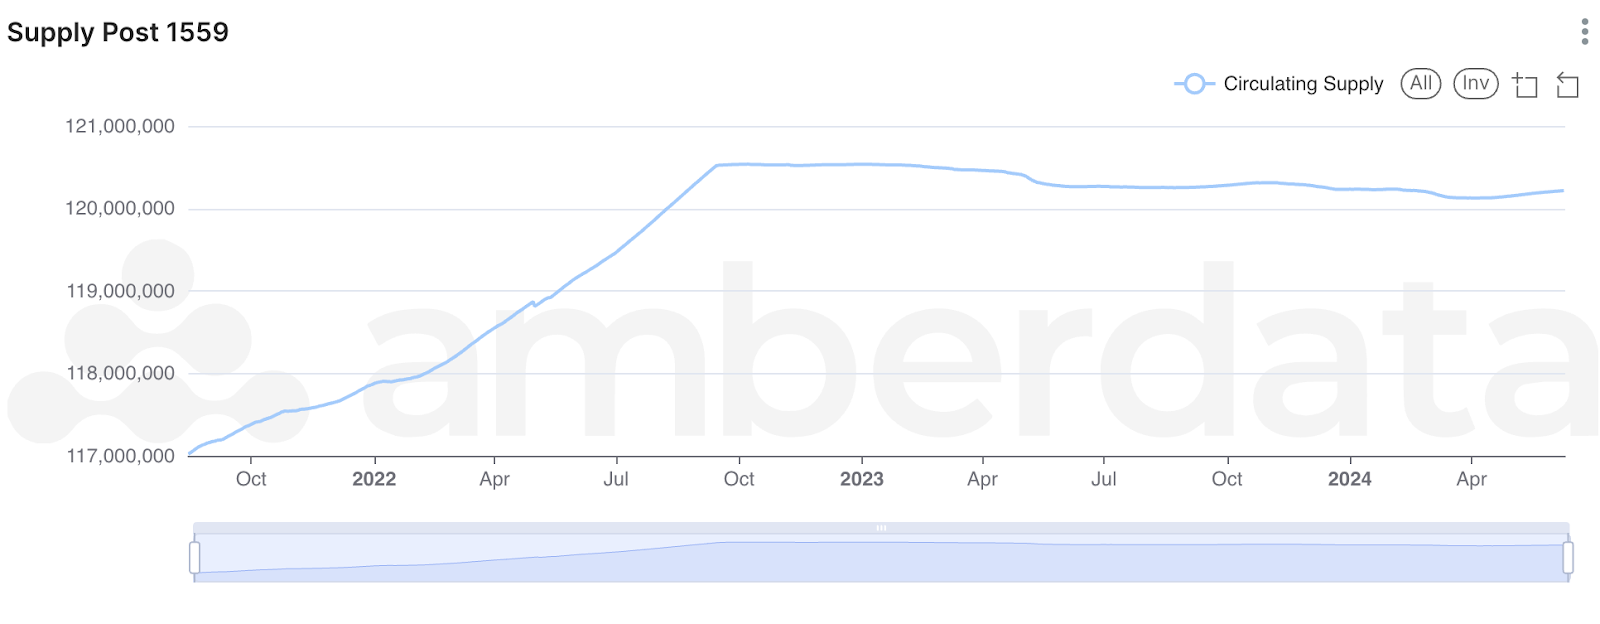
The effects of EIP-1559, implemented alongside the merger, have further influenced the circulating supply and market behavior. By introducing a mechanism to burn a portion of transaction fees, EIP-1559 has effectively reduced the overall supply of ETH. This reduction in supply can drive price increases if demand remains constant or grows. Additionally, understanding the growth rate of ETH supply aids stakeholders in evaluating Ethereum's monetary policy, assessing inflation rates, and estimating gas fees.
Market Capitalization and Supply Metrics
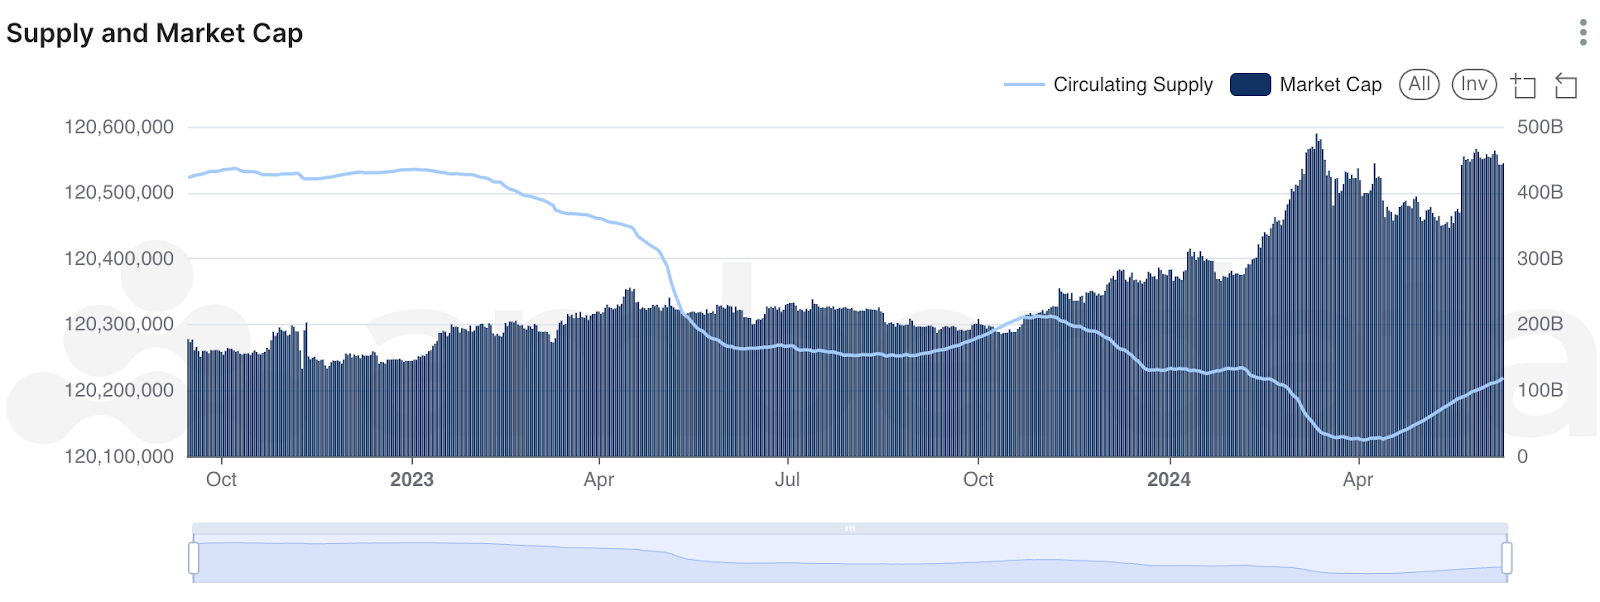
The correlation between circulating supply and market capitalization is fundamental in understanding a cryptocurrency's market dynamics. Market capitalization, calculated as the product of the circulating supply and the current price per unit, provides a snapshot of a cryptocurrency's market value.
Changes in the circulating supply directly influence market capitalization, which, in turn, affects price movements and investor sentiment. For instance, an increase in circulating supply, without a corresponding rise in demand, can lead to a decrease in price, while a decrease in supply can drive prices up if demand remains constant.
These metrics are crucial for predicting market movements and investor behavior. Investors can gauge the potential for price volatility and market liquidity by analyzing trends in circulating supply and market capitalization. For example, a sudden spike in circulating supply may signal upcoming selling pressure, prompting investors to adjust their positions. Conversely, a decreasing supply trend can indicate potential scarcity, encouraging investors to buy and hold in anticipation of price appreciation.
AmberLens provides valuable insights from daily supply change data, highlighting specific patterns that can impact market strategy. Two notable patterns include periods of significant supply reductions and sudden supply increases. Significant supply reductions often correlate with major events such as token burns or protocol upgrades, leading to decreased available supply and potential price increases. On the other hand, sudden supply increases might result from large-scale token releases or unlocks, which can increase market liquidity and introduce selling pressure, potentially driving prices down.
Ethereum Network Participation and Security
Active validators on the Ethereum network have consistently increased, reflecting growing participation and commitment to the network's Proof of Stake (PoS) consensus mechanism. This upward trend is crucial for network health and security, as a higher number of validators enhances decentralization, making the network more resilient to attacks and censorship. A more decentralized network, with decision-making power distributed among a larger group of participants, ensures greater security and stability, reducing the risk of control by any single entity or small group.

Validator deposits and withdrawals provide further insights into network dynamics. An increase in validator deposits typically signals growing trust and confidence in the network as more participants commit their assets to secure the blockchain. Conversely, significant withdrawals indicate concerns or shifts in network sentiment.
The behavior of validators, including their staking and withdrawal activities, directly affects the network's performance and stability. For instance, consistent validator participation ensures continuous transaction validation and network reliability, while large-scale withdrawals could impact network efficiency and security. Understanding these dynamics helps traders, analysts, and researchers assess the network's health, stability, and potential risks.
Final Thoughts
In summary, leveraging Ethereum network supply metrics through tools like AmberLens provides critical insights into Ethereum's supply dynamics, market capitalization, and network security, enabling institutional investors to optimize their portfolios and assess risks effectively. By understanding the historical and real-time metrics such as staking activities, validator trends, and transaction volumes, investors can make informed decisions to maximize returns and minimize risks.
AmberLens Market Intelligence is available for anyone to use for free. For institutional investors interested in the underlying historical metric data behind AmberLens charts (available in AWS S3, Databricks Google Analytics Hub, and Snowflake), ask for a demo.
